Conditional Styling
Several widgets support conditional styling, similar to conditional formatting in Excel.
This page is a reference for what features of each widget accept conditional styling, as well as some examples of practical applications.
Three types of conditions are available:
-
Simple condition: supports the following operators
-
=equal to -
!=not equal to -
>greater than -
>=greater than or equal to -
<less than -
<=less than or equal to
-
-
Range condition: Only available for
FLOATandINTdata types. The min point and max point is prefilled based on your data, but can be changed. -
Unique condition: The system picks a color based on the uniqueness of the value.
Widgets
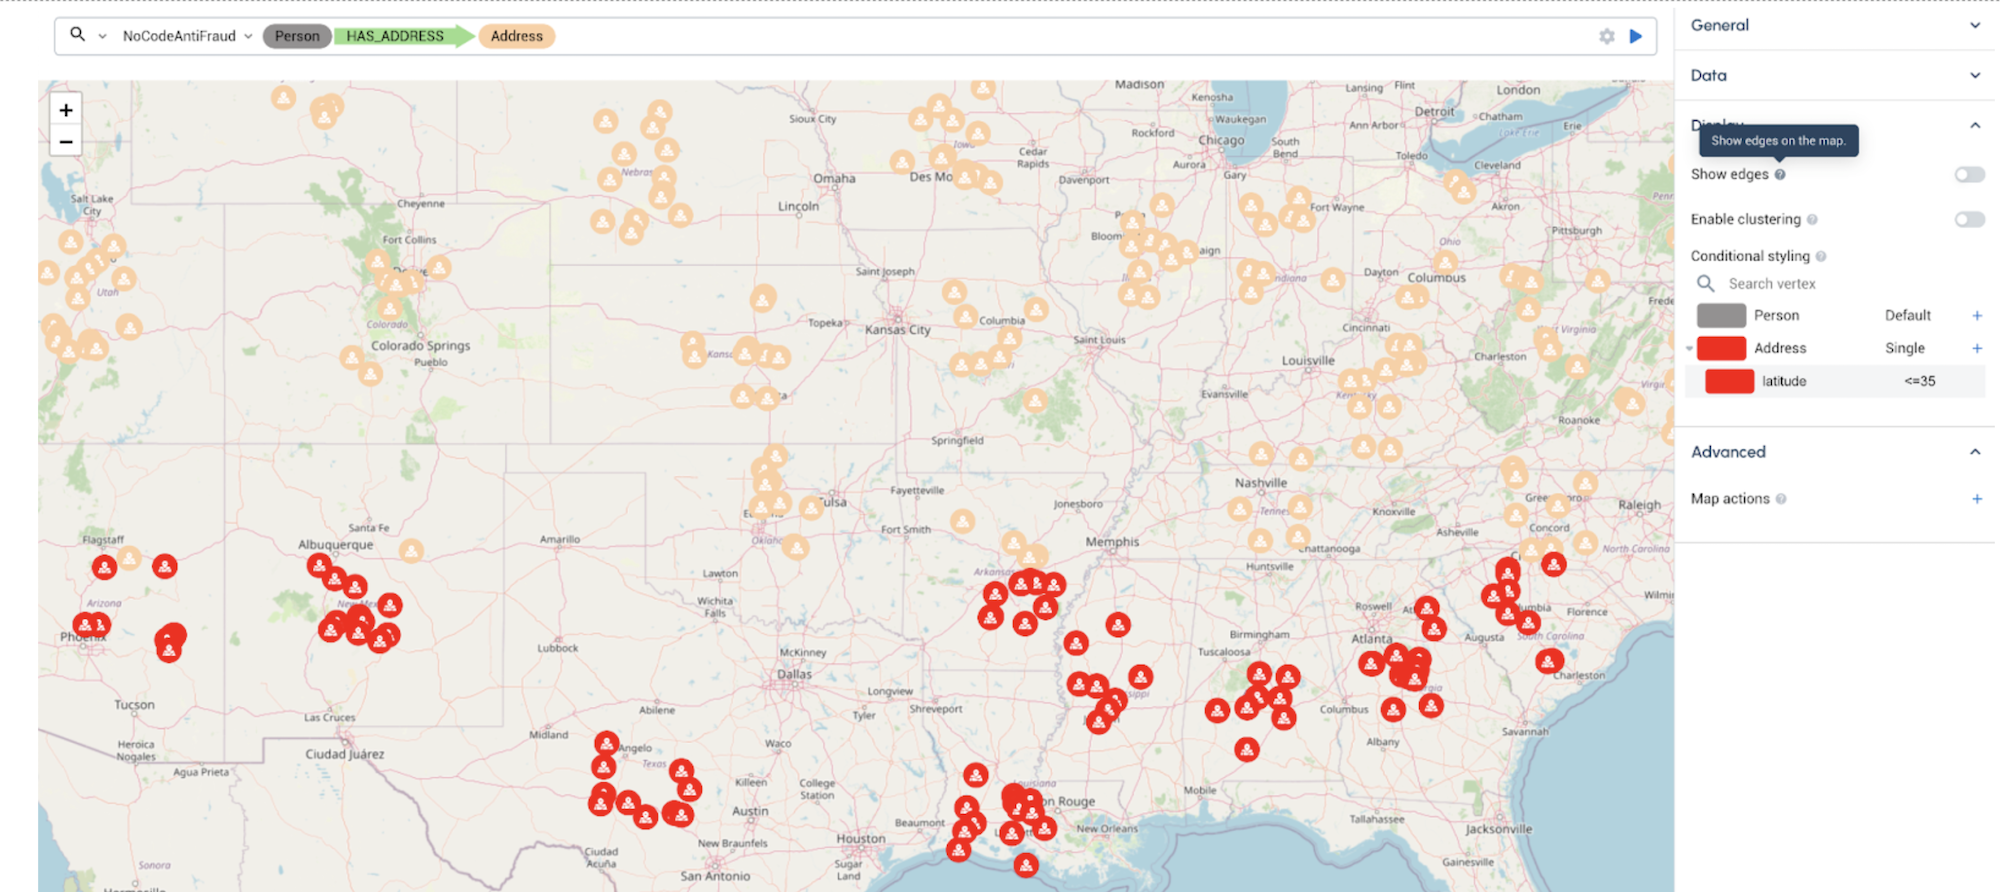
The Table, Graph, and Map widgets support conditional styling.
Table
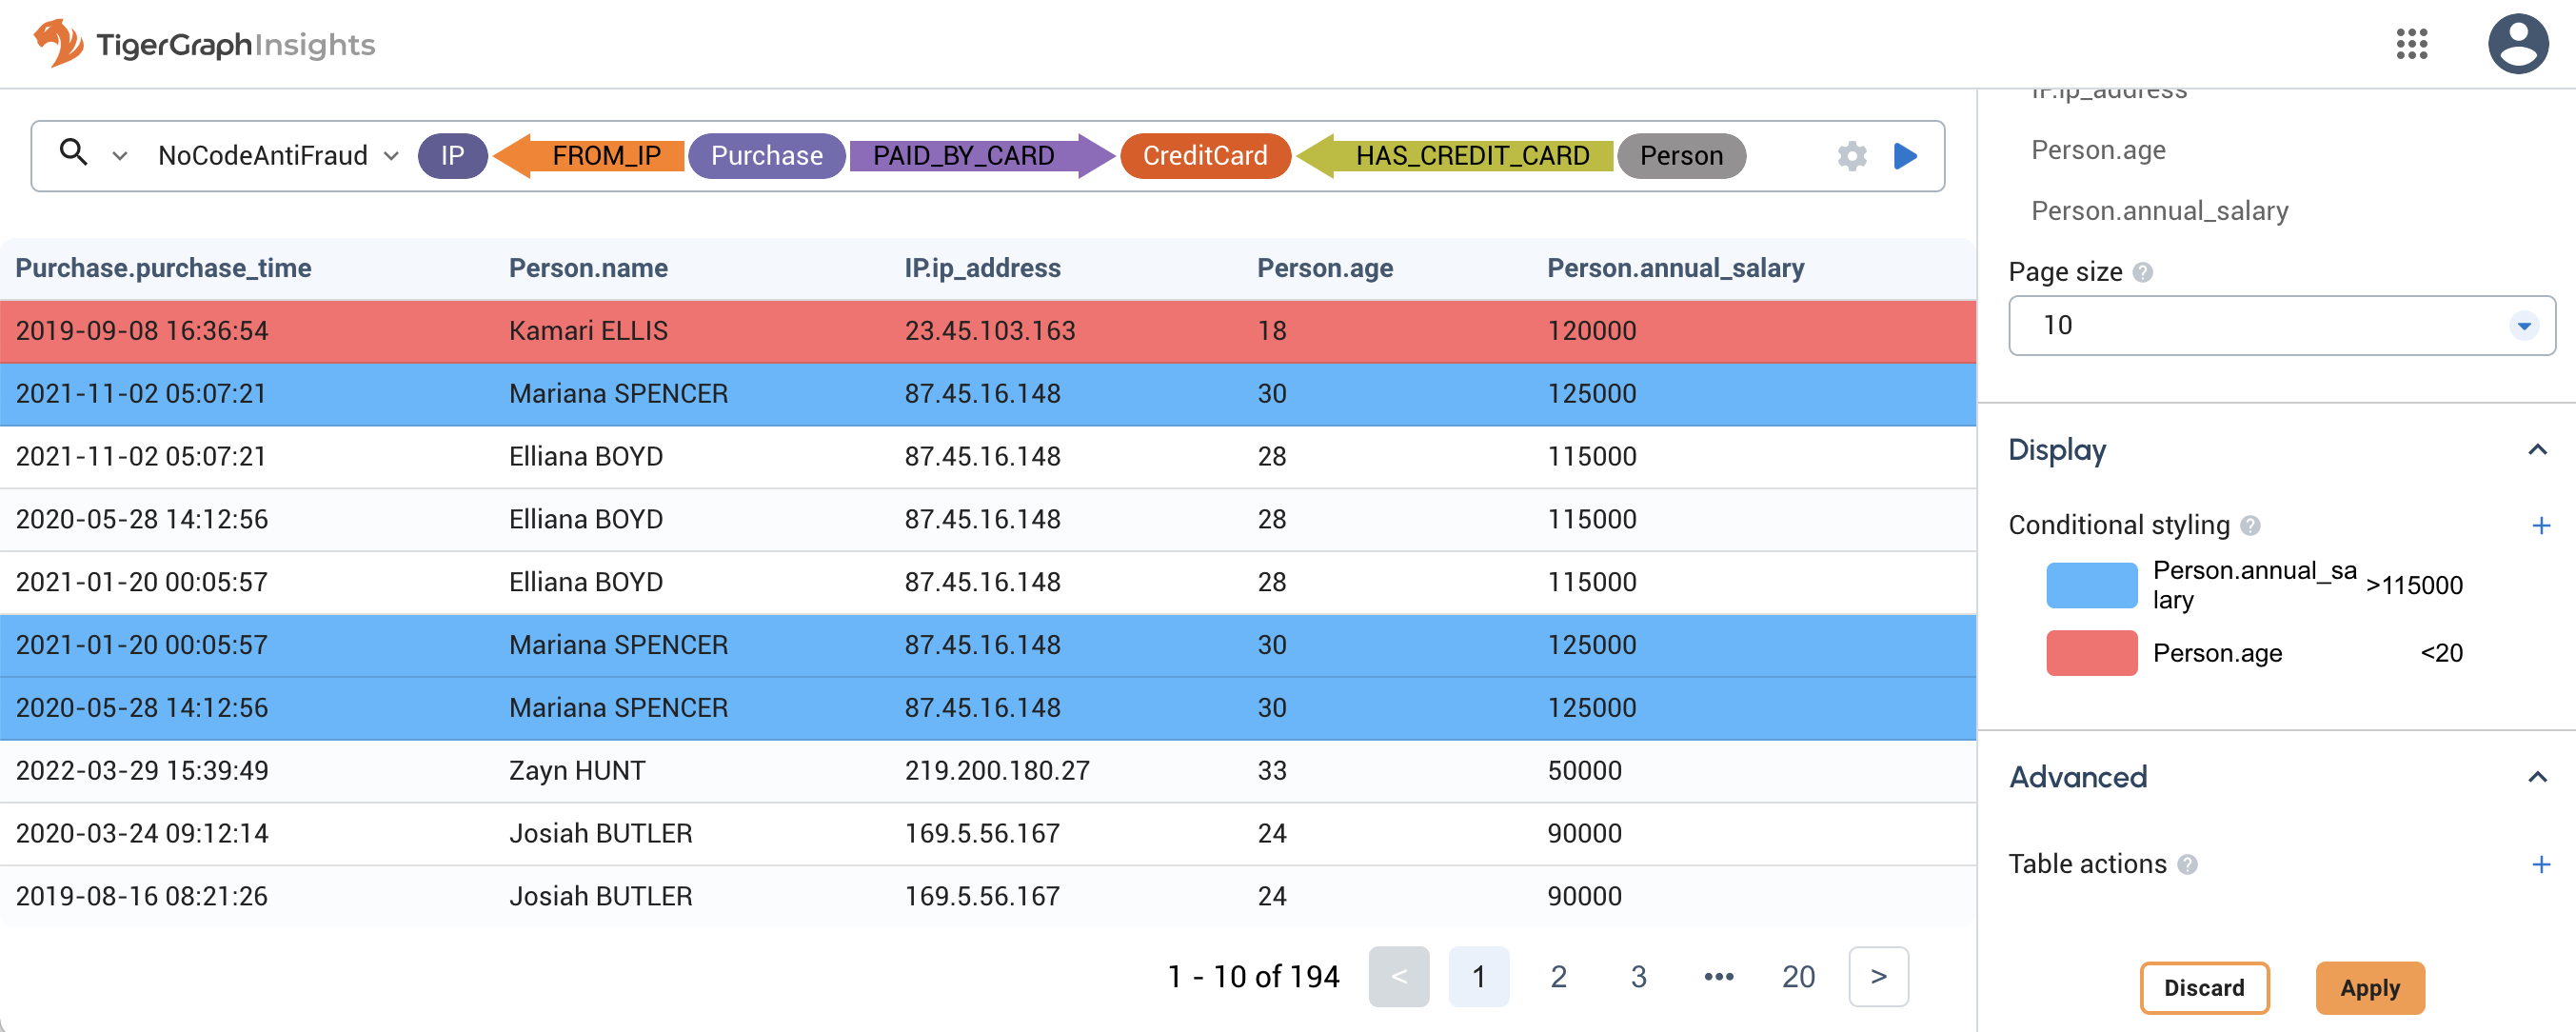
Table widgets support highlighting a row in a certain color based on a single column value.

In this example, Person vertices with an annual salary of over $115,000 are highlighted blue and Person vertices with an age under 20 are highlighted red. The conditions execute in order from top to bottom, so even though the first row in the shown results matches both conditions, the red overwrites the blue.
Graph
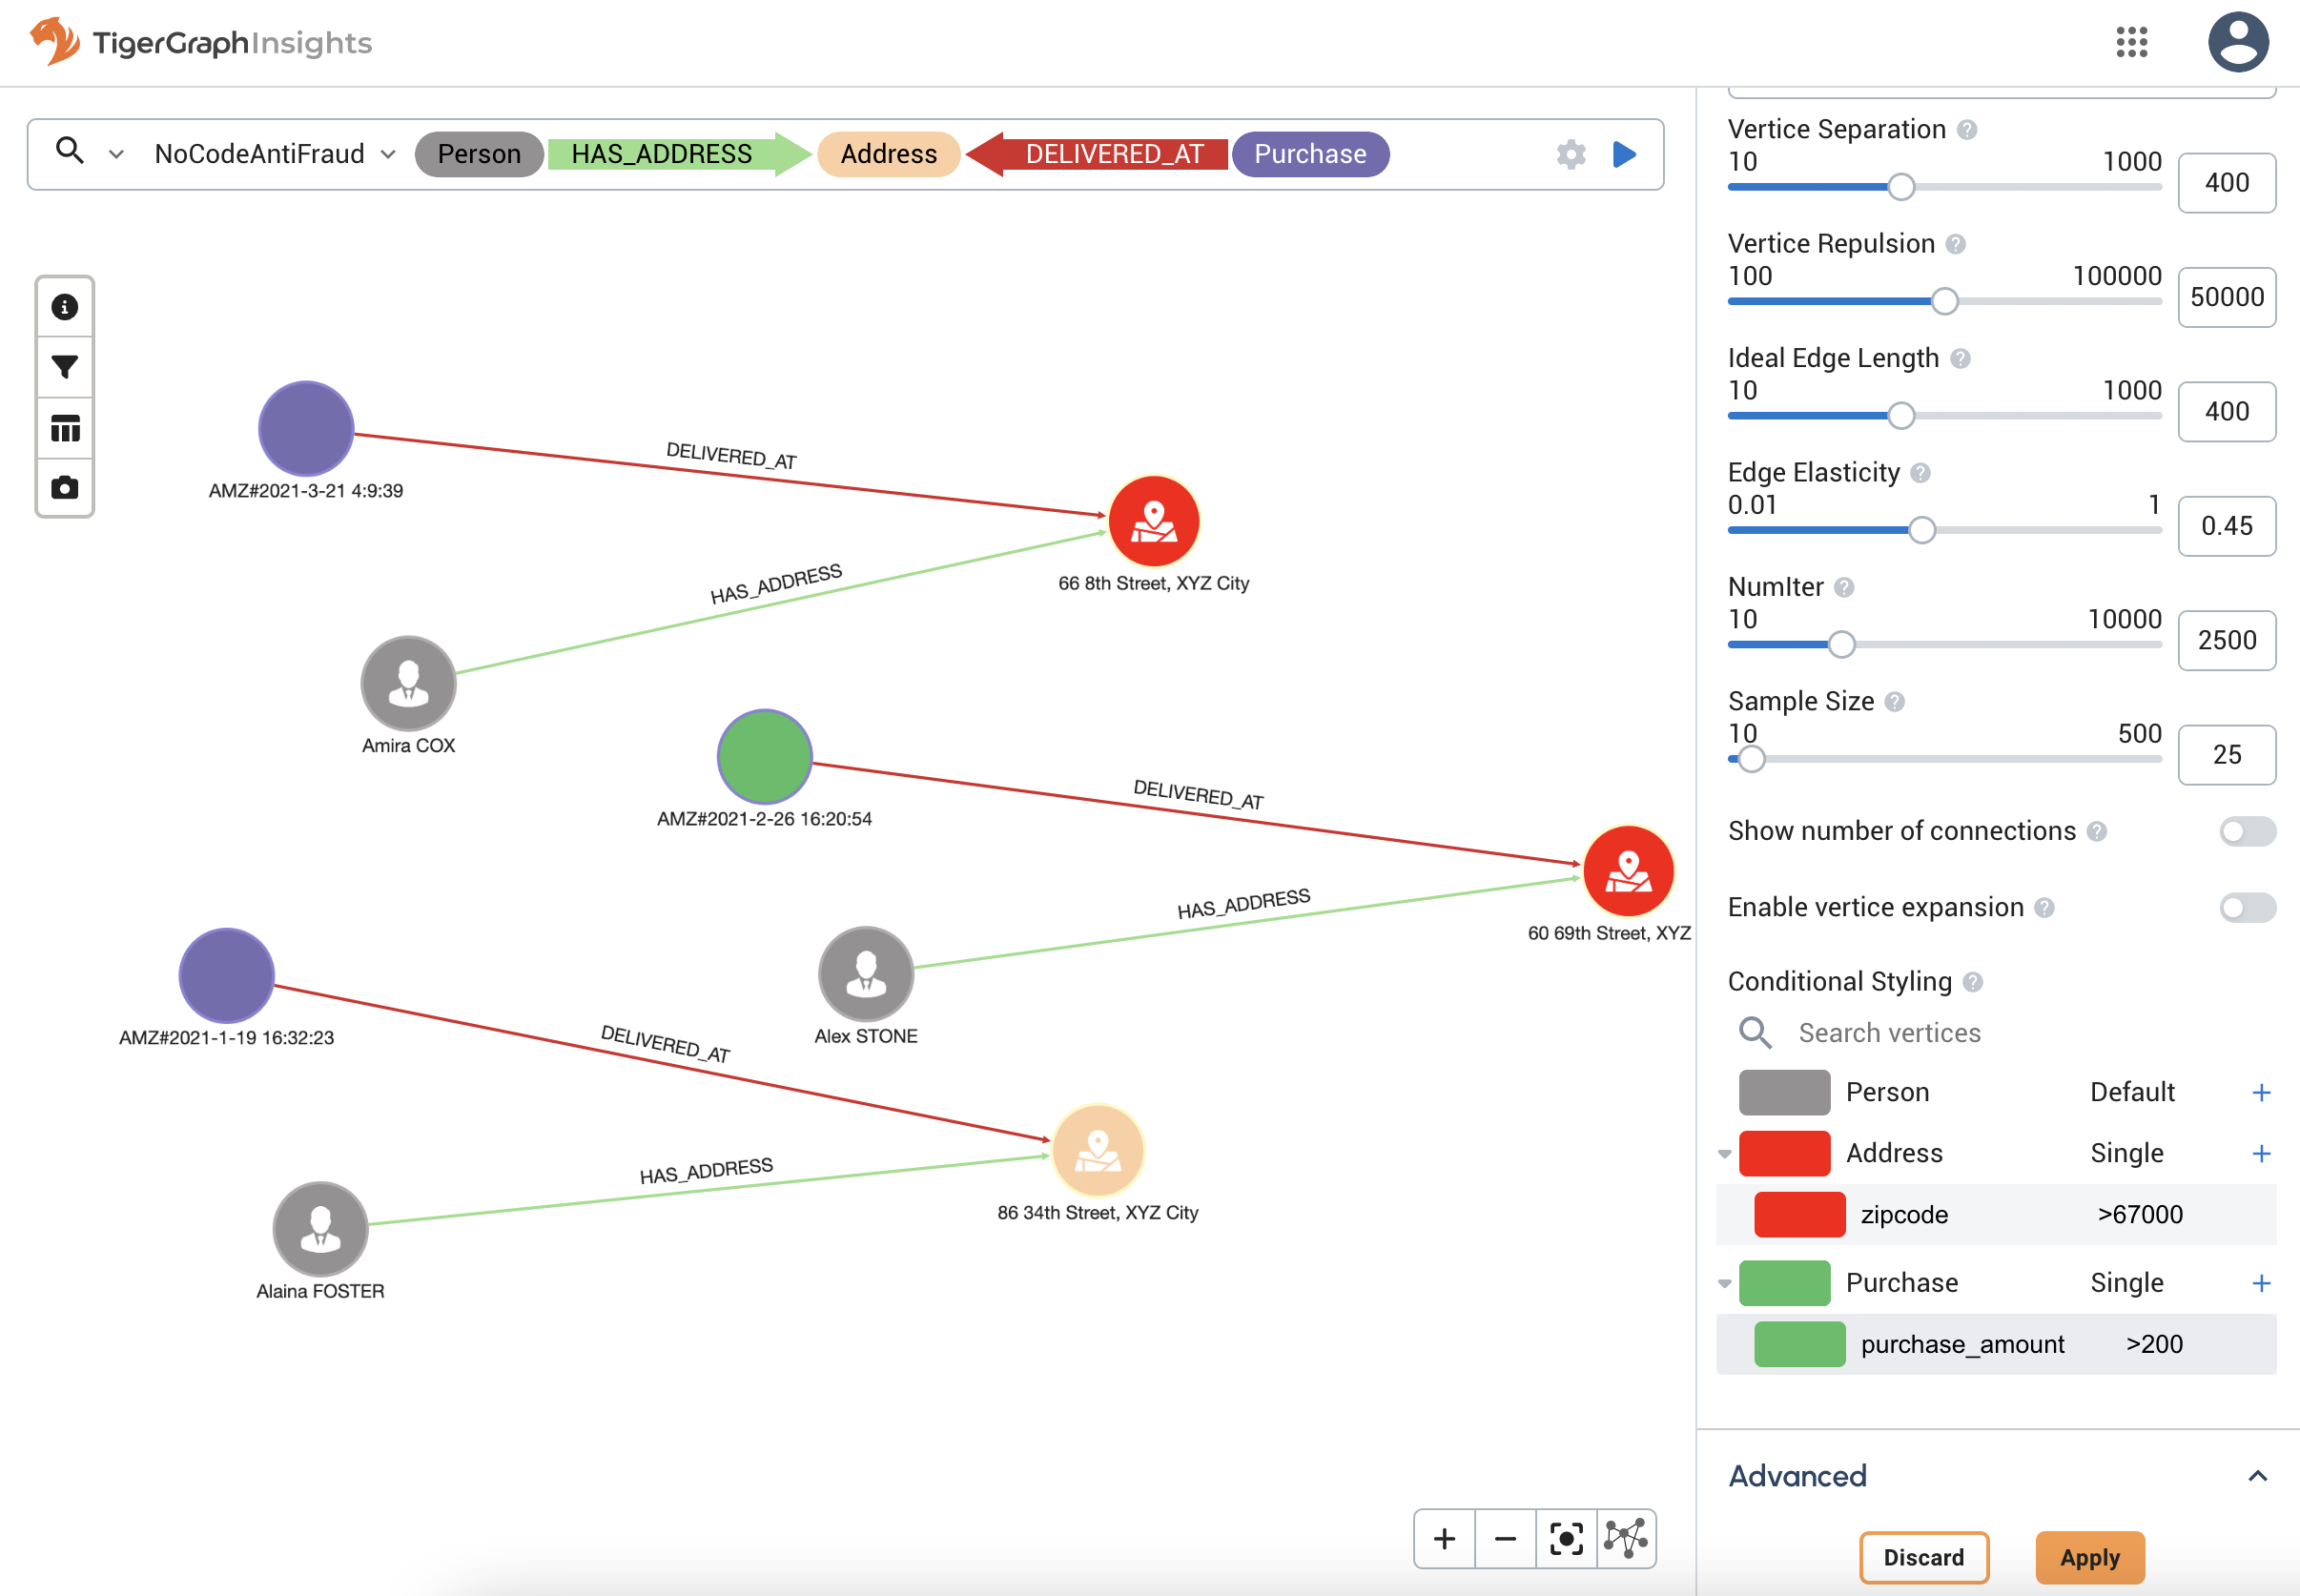
Graph widgets support highlighting vertices based on their attribute values. You can also choose to resize vertices based on their attribute values to show importance.

This view shows three transactions between a Person (gray), an Address (beige), and a Purchase (purple). Conditional styling has been applied to make all addresses with a ZIP code above 67000 red, and all Purchases with an amount over 200 green.
