Bar Chart Widget
The Bar Chart Widget displays a bar chart created from the results of a pattern match search of your database.
Inputs
Accepts data as vertices and edges for a pattern search result. For a GSQL query result, accepts a list of objects that contain at least one numeric attribute to be used as the height of the bar.
Widget window
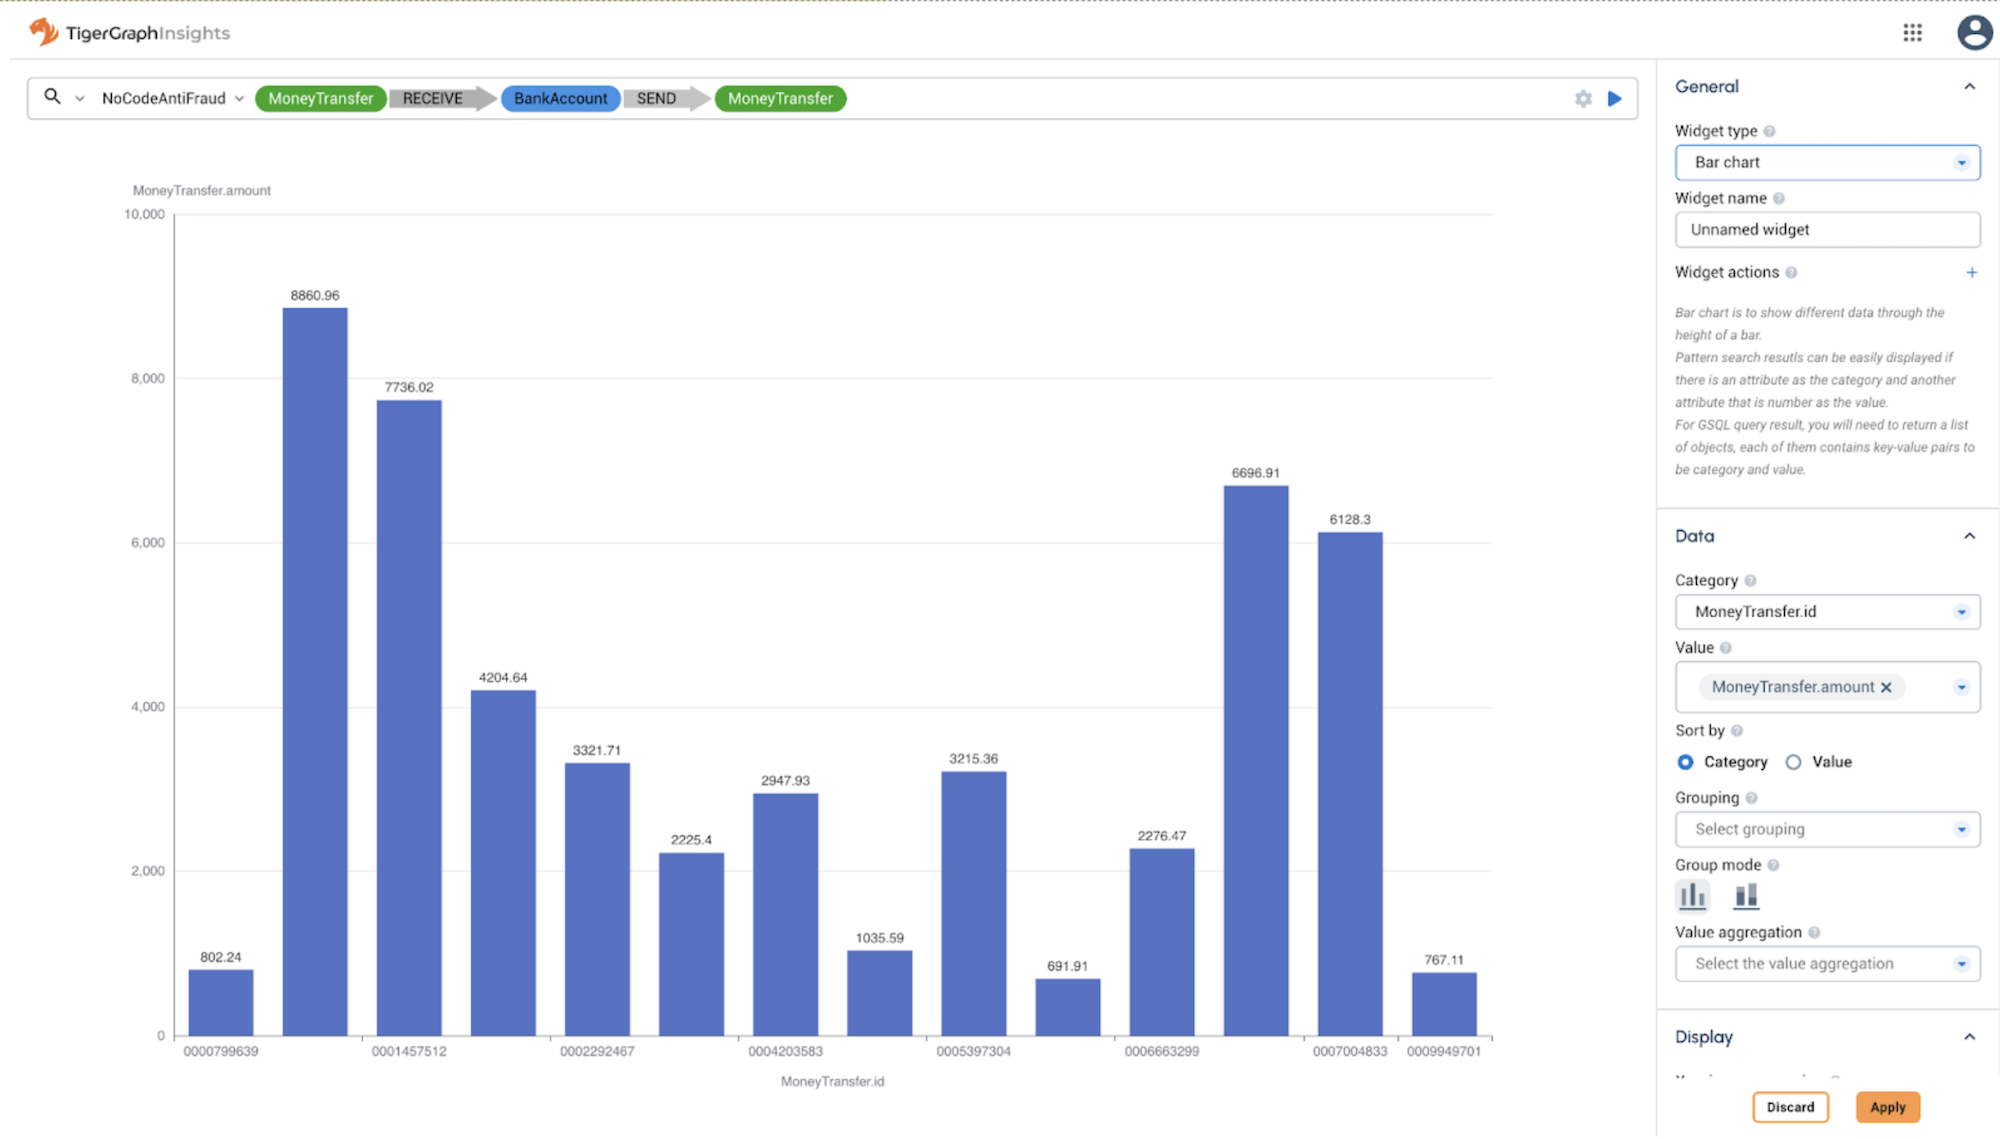
Sorting and grouping
Customize the category (the name of each bar) and one or more numeric values to display as stacked or adjacent bars in each category.
Sort the data by the category name (alphabetical left to right) or value (increasing left to right).
By default, grouping is done by combining adjacent bars into a summary bar. You can also adjust it to stack the bars in different colors.
Aggregate data with COUNT, AVG, SUM, MAX, and MIN functions.