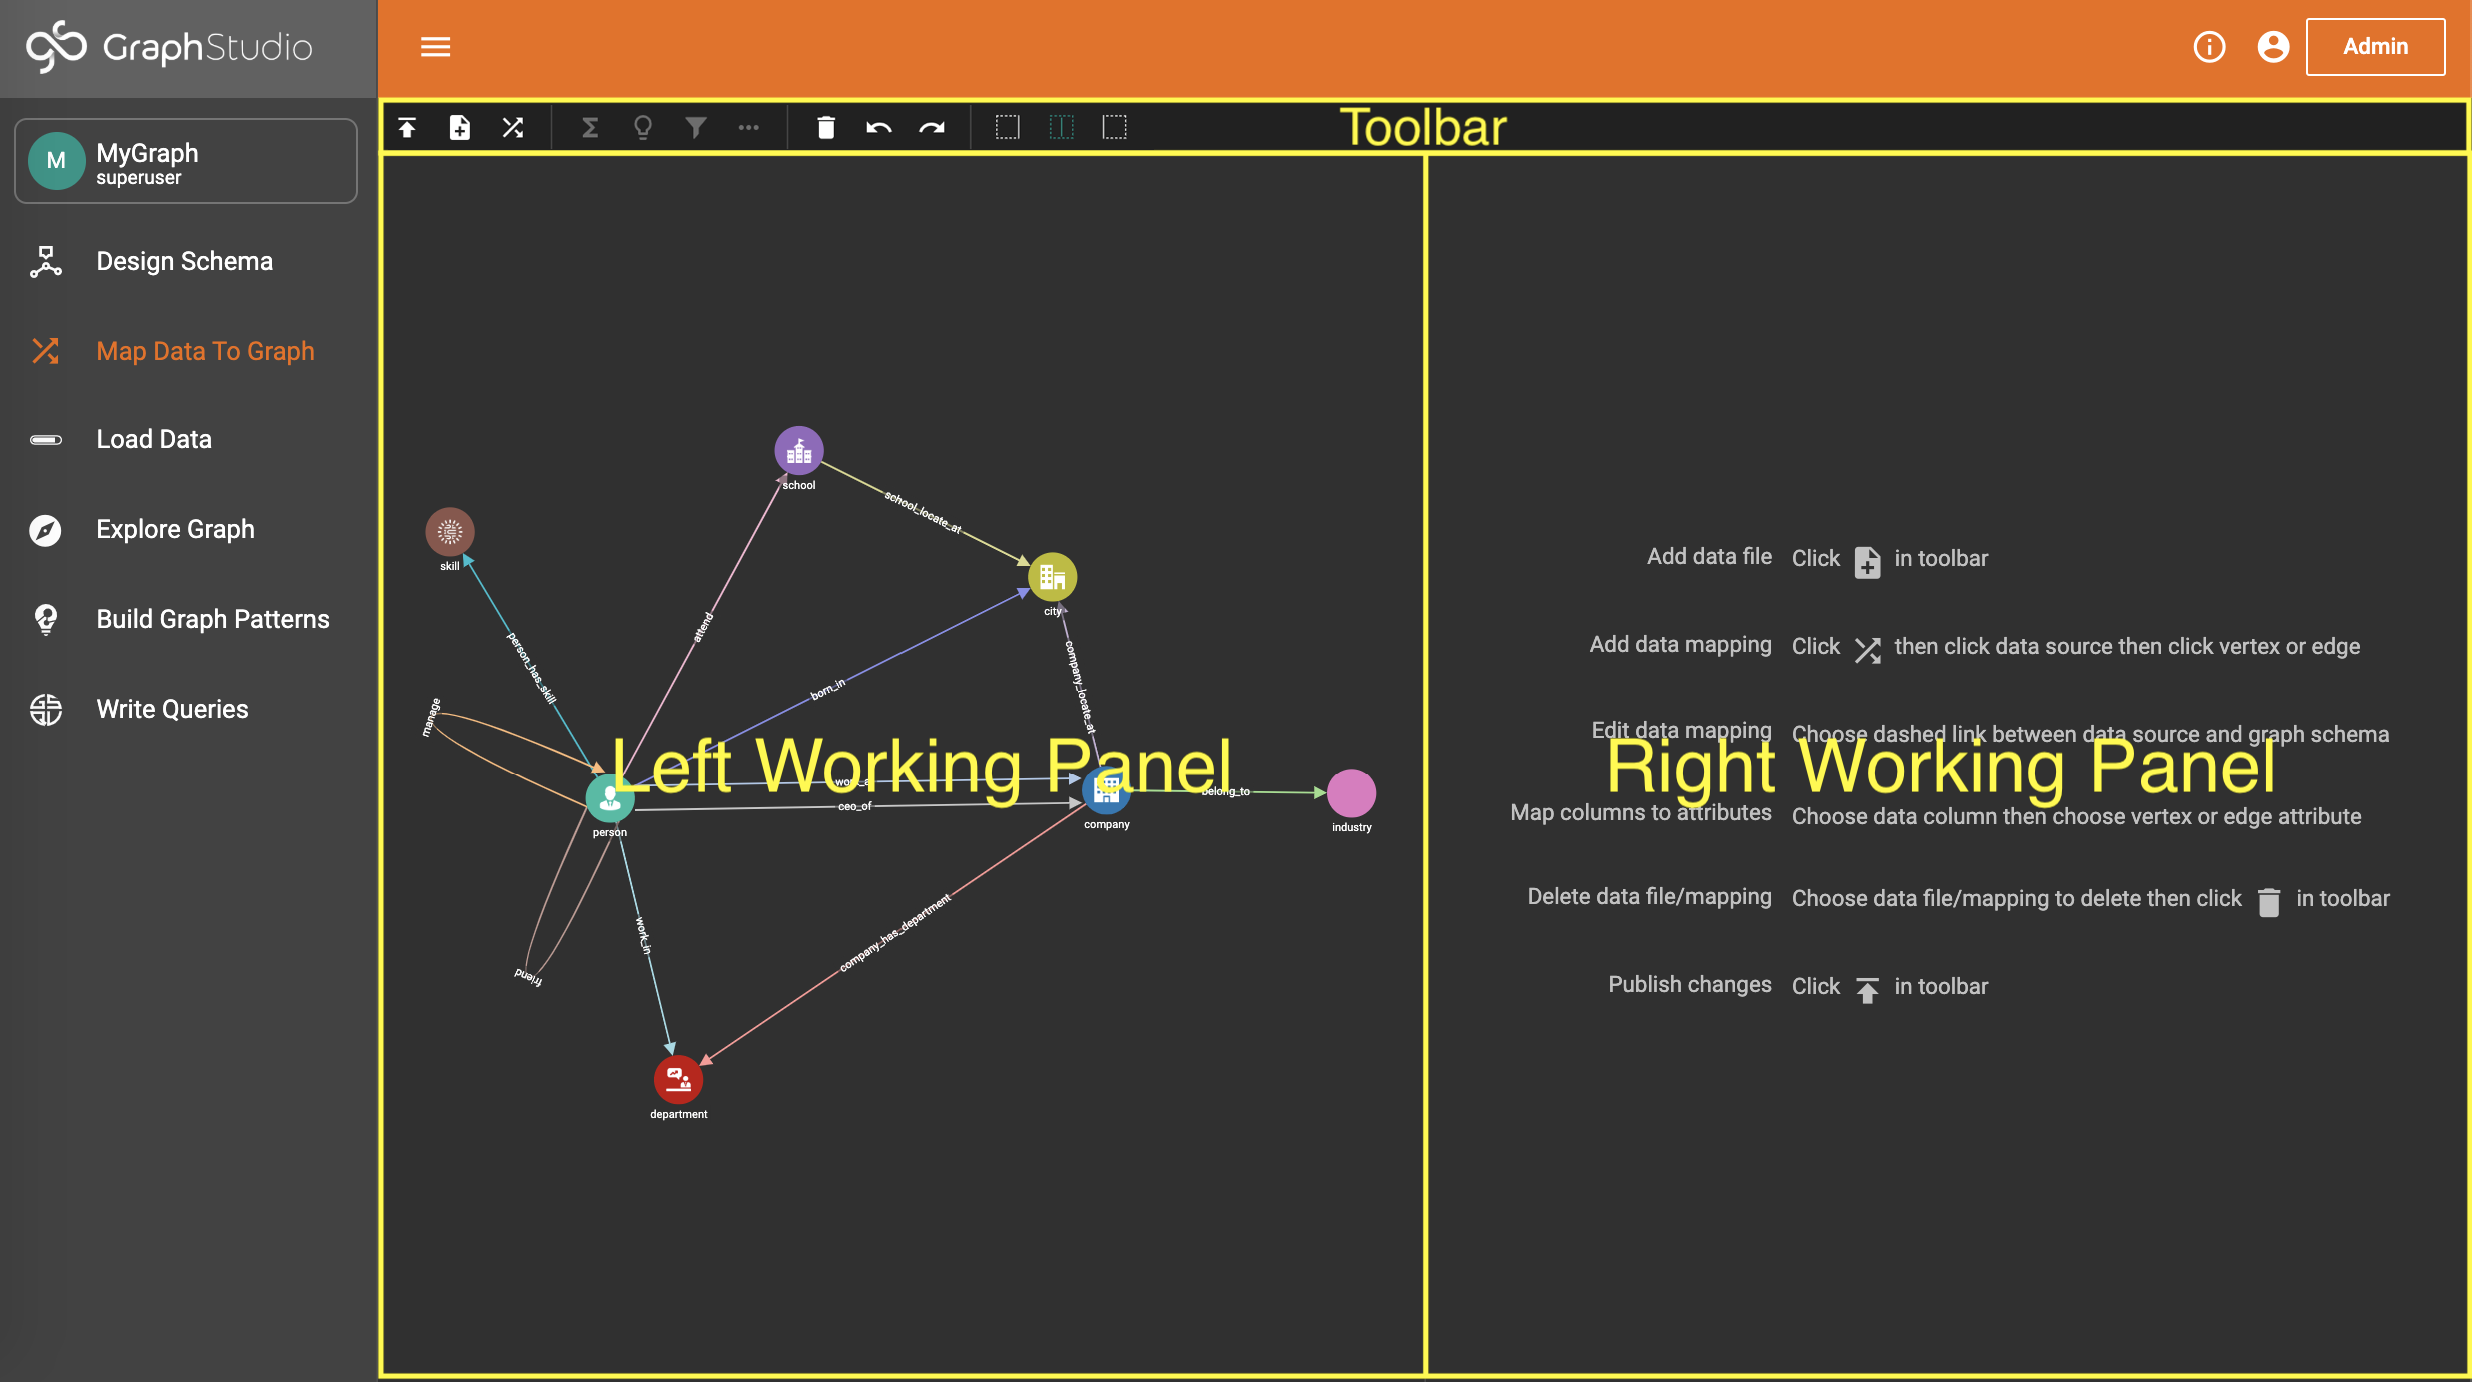
Map Data To Graph
Map data to graph
After you have created a graph schema, the next major step is to map your data to the schema. Click "Map Data To Graph" on the left side menu bar. The working panel is split into a left panel and a right panel. Before any data is mapped, the left panel will display only the graph schema.
The main steps are
-
Select a data source.
-
Add data file(s)
-
Map data file(s) to vertex/edge types
-
Map data file columns to vertex/edge fields
-
Publish data mapping
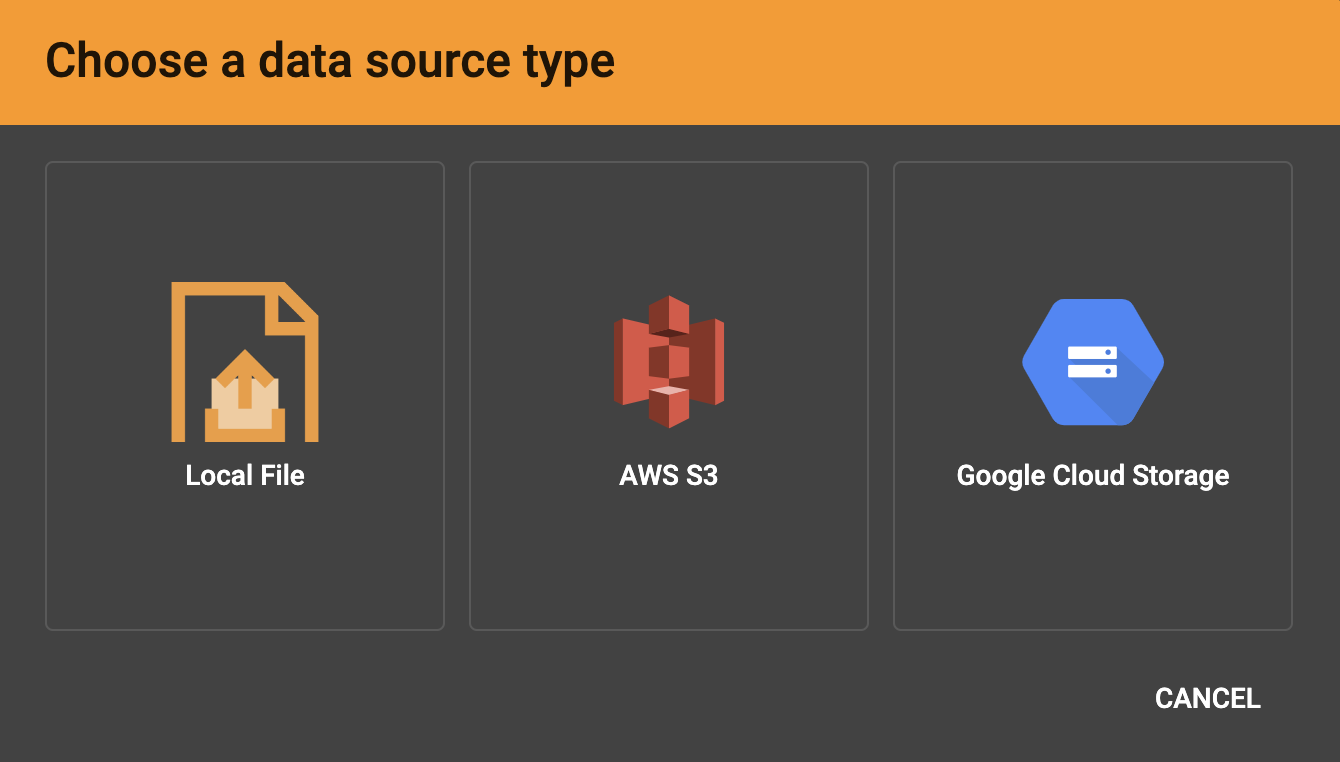
Select a data source type
GraphStudio supports loading data from local files on the TigerGraph server, from files stored on Amazon S3, or from files stored on Google Cloud Storage (GCS).
Click the Add Data File button  in the toolbar to add data files.
-
If you select Local File, no more configuration is needed in this stage. Skip to Add local data file.
-
For AWS S3, skip to the section Create S3 data source.
-
For Google Cloud Storage, skip to the section Create a GCS data source.
Add data files
A data file is a file containing structured data to be loaded into the graph, creating vertex and/or edge instances. After specifying your data source type, the next step is to specify your data files.
This section contains subsections for each data source.
-
Local File System - Add local data file
-
AWS S3 - Create S3 data source
-
GCS - Create a GCS data source
Add local data file
After clicking Local File, you will be prompted to choose one or more local files to upload through the GUI.
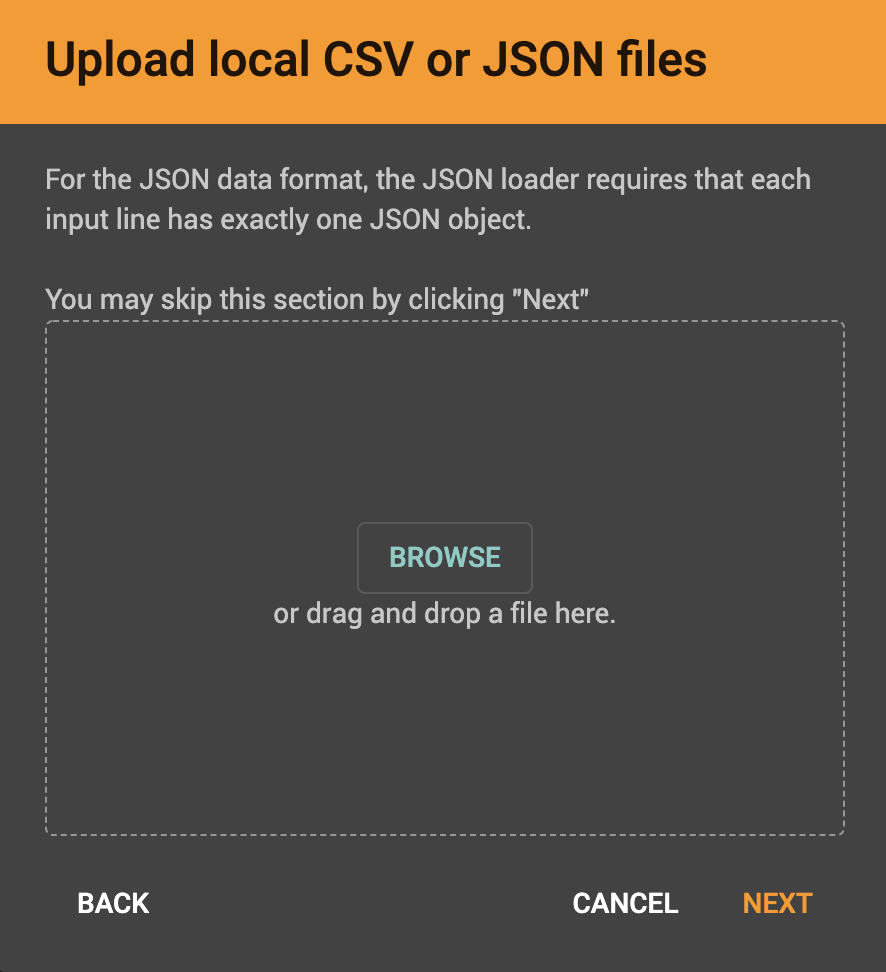
If all the files are uploaded successfully, a message of success will appear at the bottom of the screen. After you see that message, you may click Next.
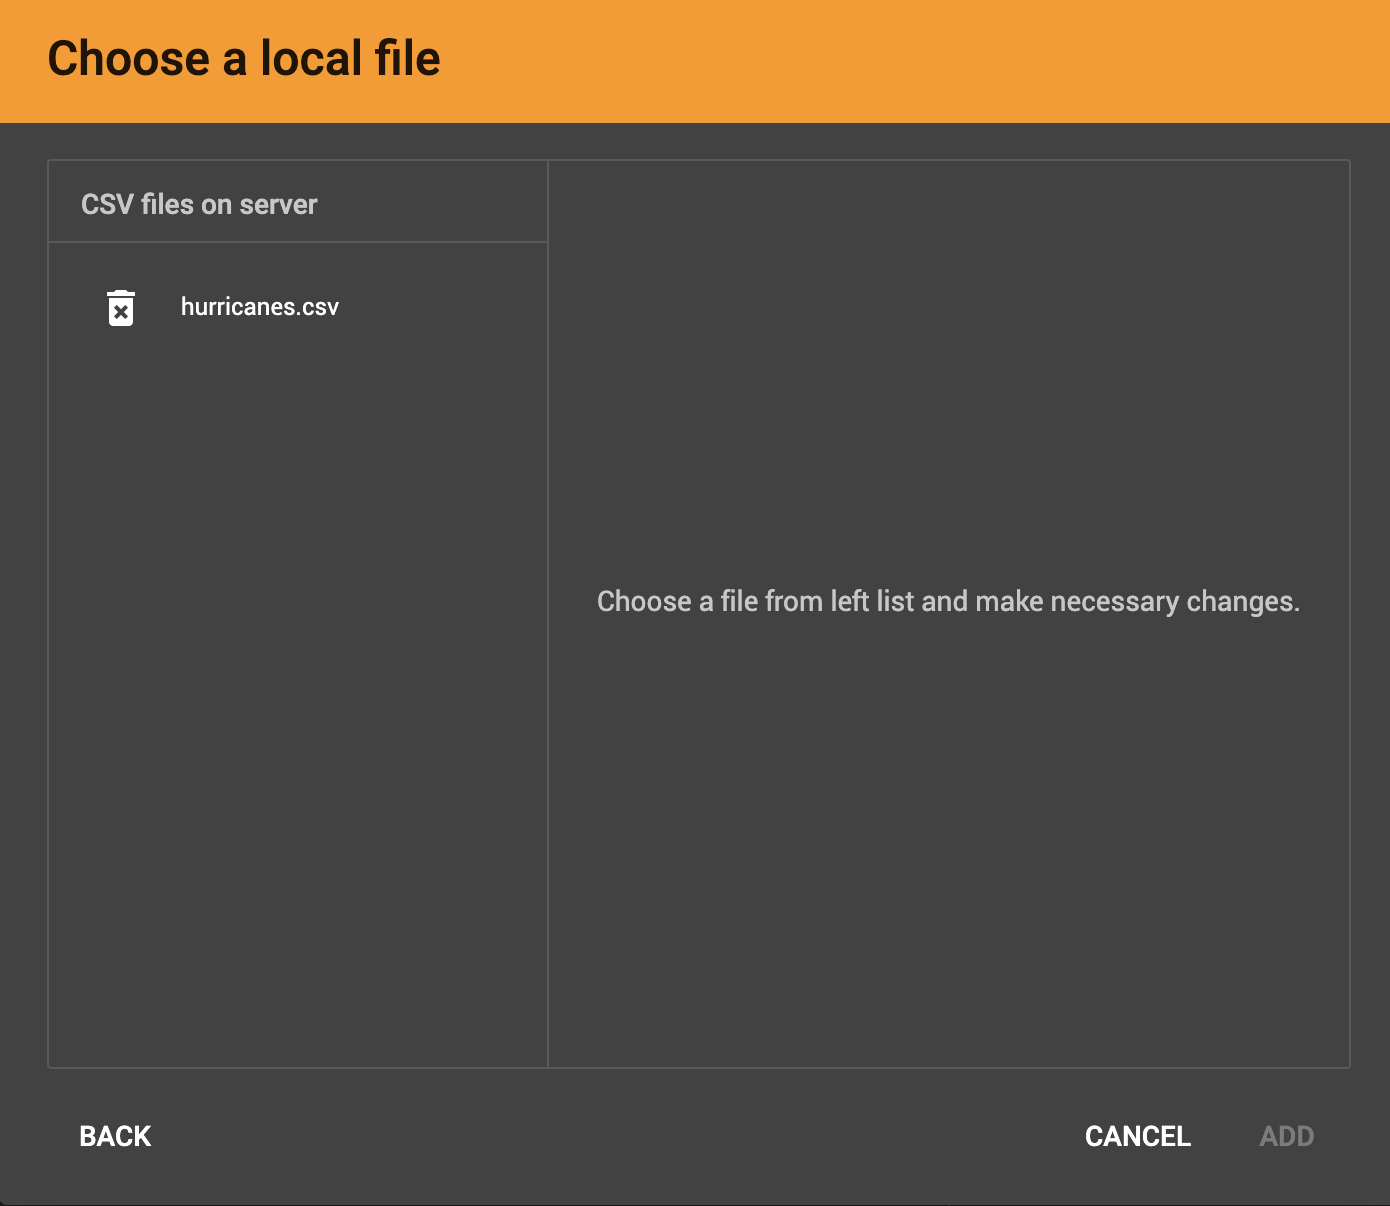
Once the files are uploaded to the server, they will appear in the "Files on server" list on the left side of the Add Data Files window. If you chose to upload JSON files, you will only see JSON files, and if you chose to upload CSV files, you will only see CSV files.
|
Data Files must be either .csv or .json files to allow data mapping in GraphStudio. |
Configure the File Parser
In this step, you tell GraphStudio how to parse your data file. If your data file is in tabular format, the parser will split each line into a series of tokens. If your file is in JSON format, first read Load a JSON file.
Choose a file from the file list to show a preview of the parsed data:
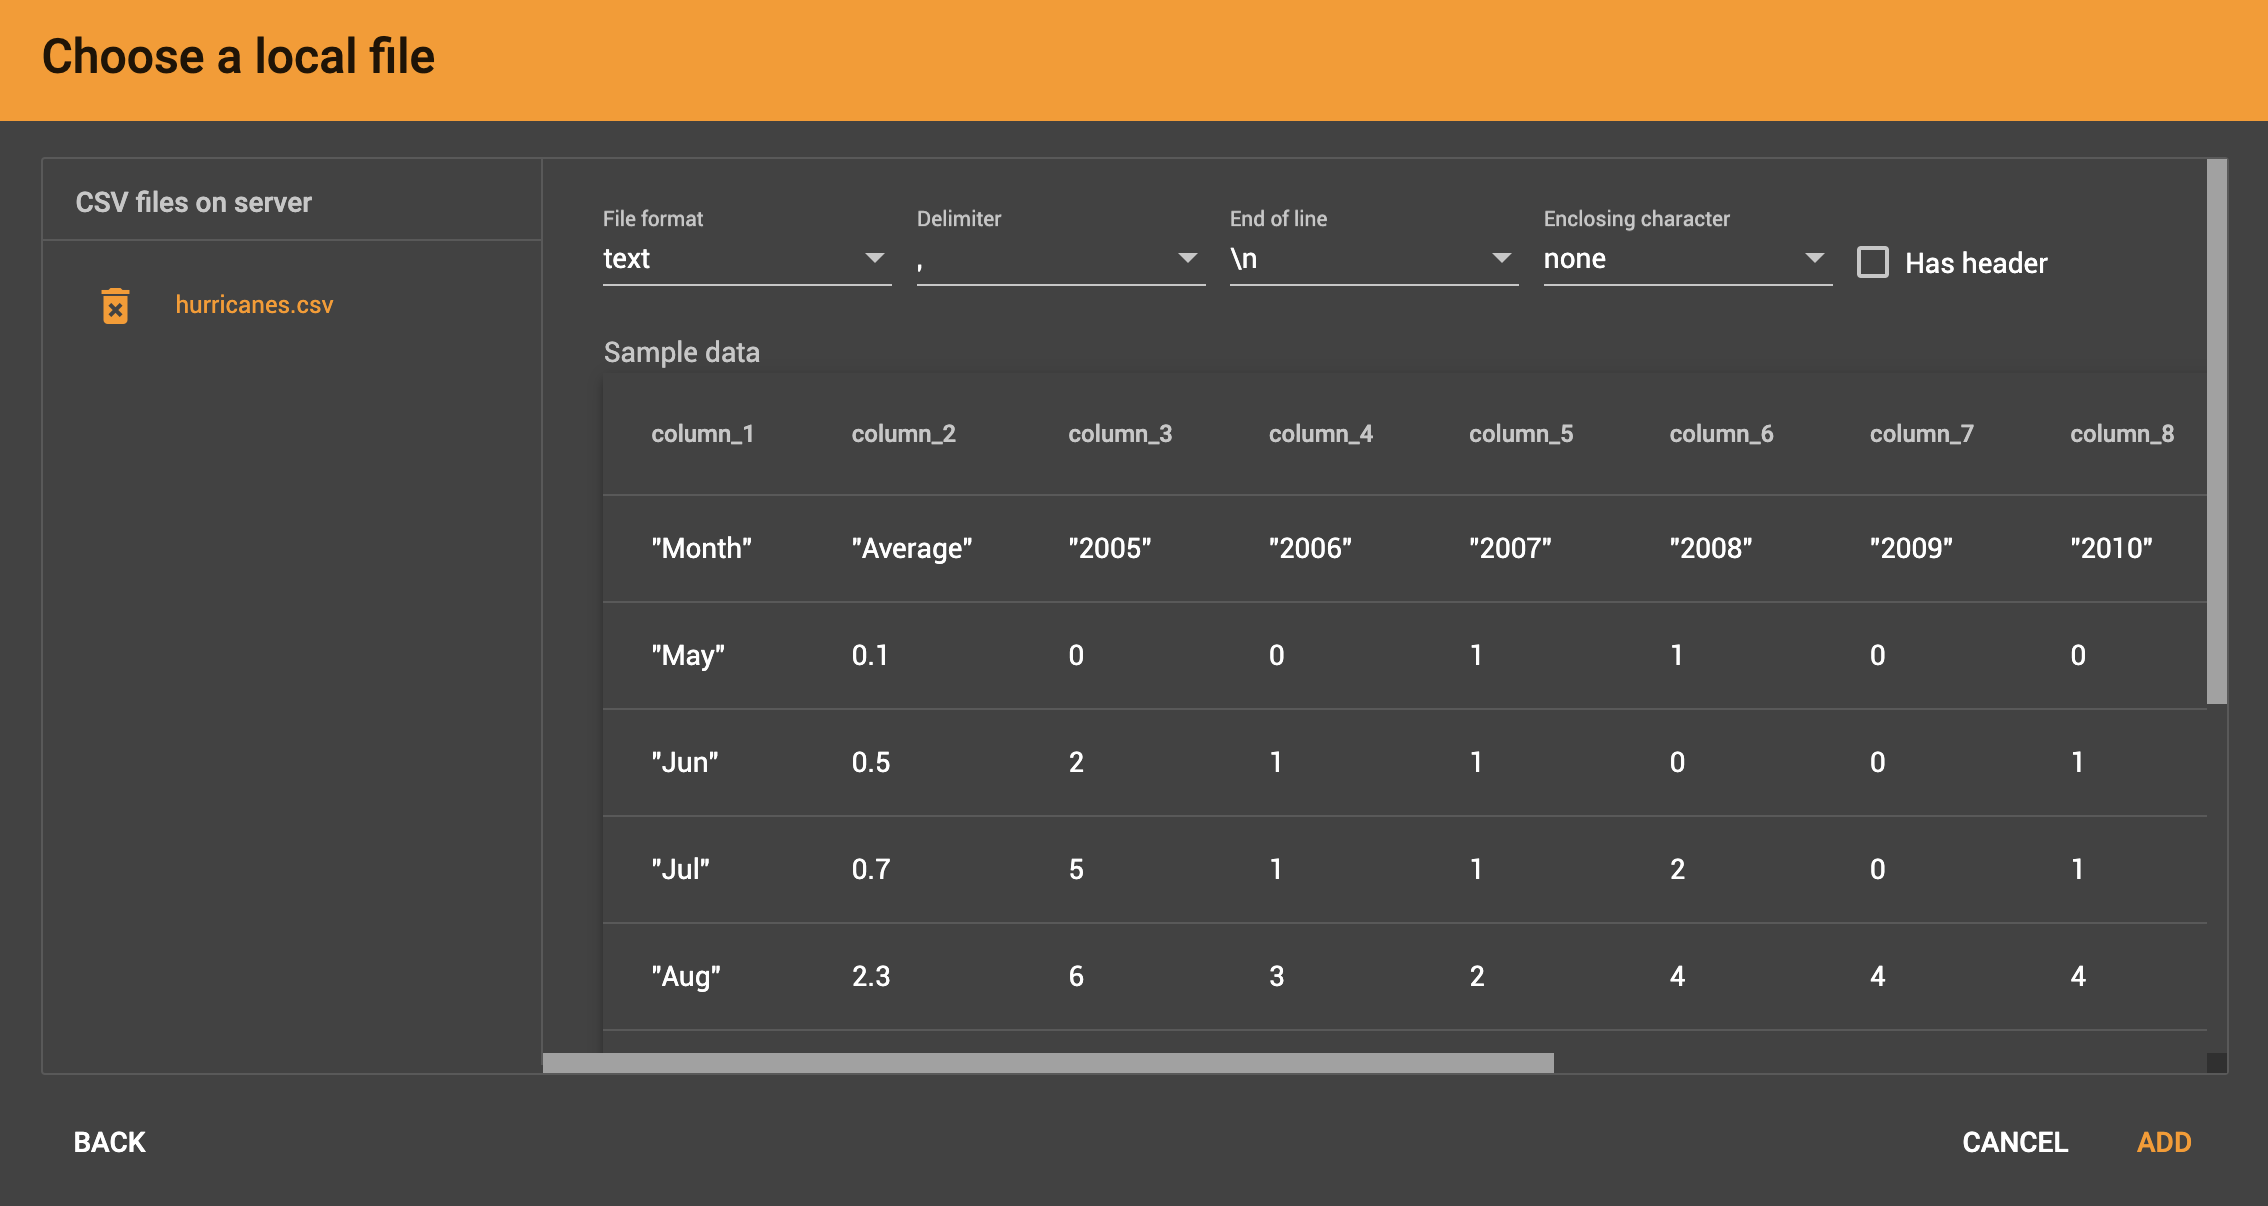
If the parsing is not correct, choose a different option for the file format, delimiter, or end of line character.
The enclosing character is used to mark the boundaries of a token, overriding the delimiter character. For example, if your delimiter is a comma, but you have commas in some strings, then you can define single or double quotes as the enclosing character to mark the endpoints of your string tokens.
It is not necessary for every token to have enclosing characters; the parser will use enclosing characters when it encounters them.
You can edit the header line of the parsing result to make the data mapping more intuitive. This doesn’t affect the data loading because the header line will be ignored.
Once you are satisfied with the file parsing configuration, click the ADD button to add the data file into the left working panel.
If a file is no longer needed, you can remove it from the server by clicking the delete button  to the left of each file.
| After removing a file from the server, you also need to manually remove data mapping using that file. Otherwise, a "file not on server" error will be triggered when loading data. |
Continue with Map data files to vertex type or edge type.
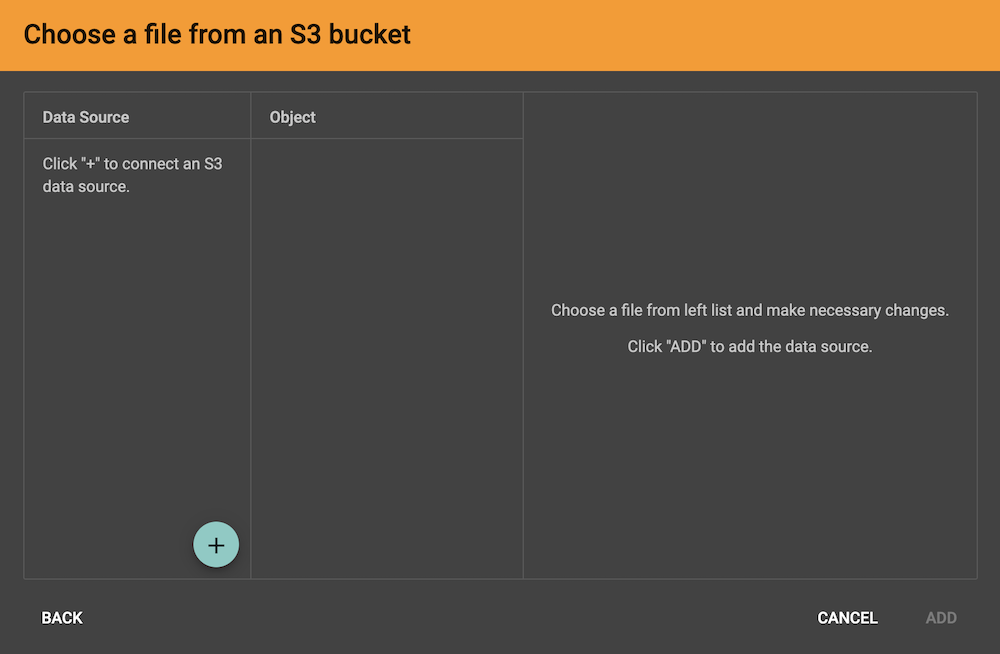
Create S3 data source
TigerGraph creates a connection to S3 in order to access the file system in an S3 bucket. Only one file may be selected at a time.
|
Data files, after decompression, must be in either CSV or Parquet format. If a file is in Parquet format, the data you are loading cannot use INT96 data types. Date in INT96 types are not loaded into TigerGraph and the respective attribute will be left empty. TigerGraph supports loading from archived and compressed S3 files directly. Currently supported file extensions include zip, tar.gz, tgz and tar. GraphStudio detects the file extension and automatically chooses the corresponding file format. If the file is encoded with one of these formats but has a non-standard file extension, you can manually specify the file format. |
-
After you click the S3 data source icon, you will be prompted to first connect an S3 data source.
-
Click the Add new data source button
 to bring up the new S3 data source window.
Give a name to the data source and provide the access key id and secret access key to connect to S3.
to bring up the new S3 data source window.
Give a name to the data source and provide the access key id and secret access key to connect to S3.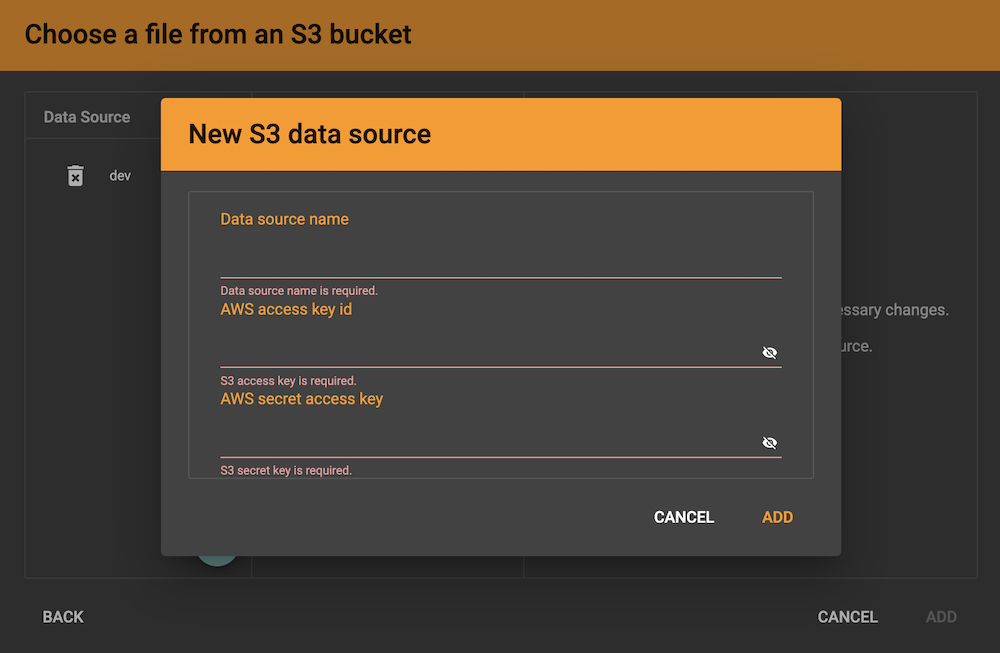
-
Click the ADD button and the data source will appear in the Data Source list.
-
Clicking the data source in the list expands a file tree listing all buckets and folders accessible by the credentials provided.
-
Choose the file you want to add and change the parsing options if necessary. The first ten lines of the selected file appear as a preview.
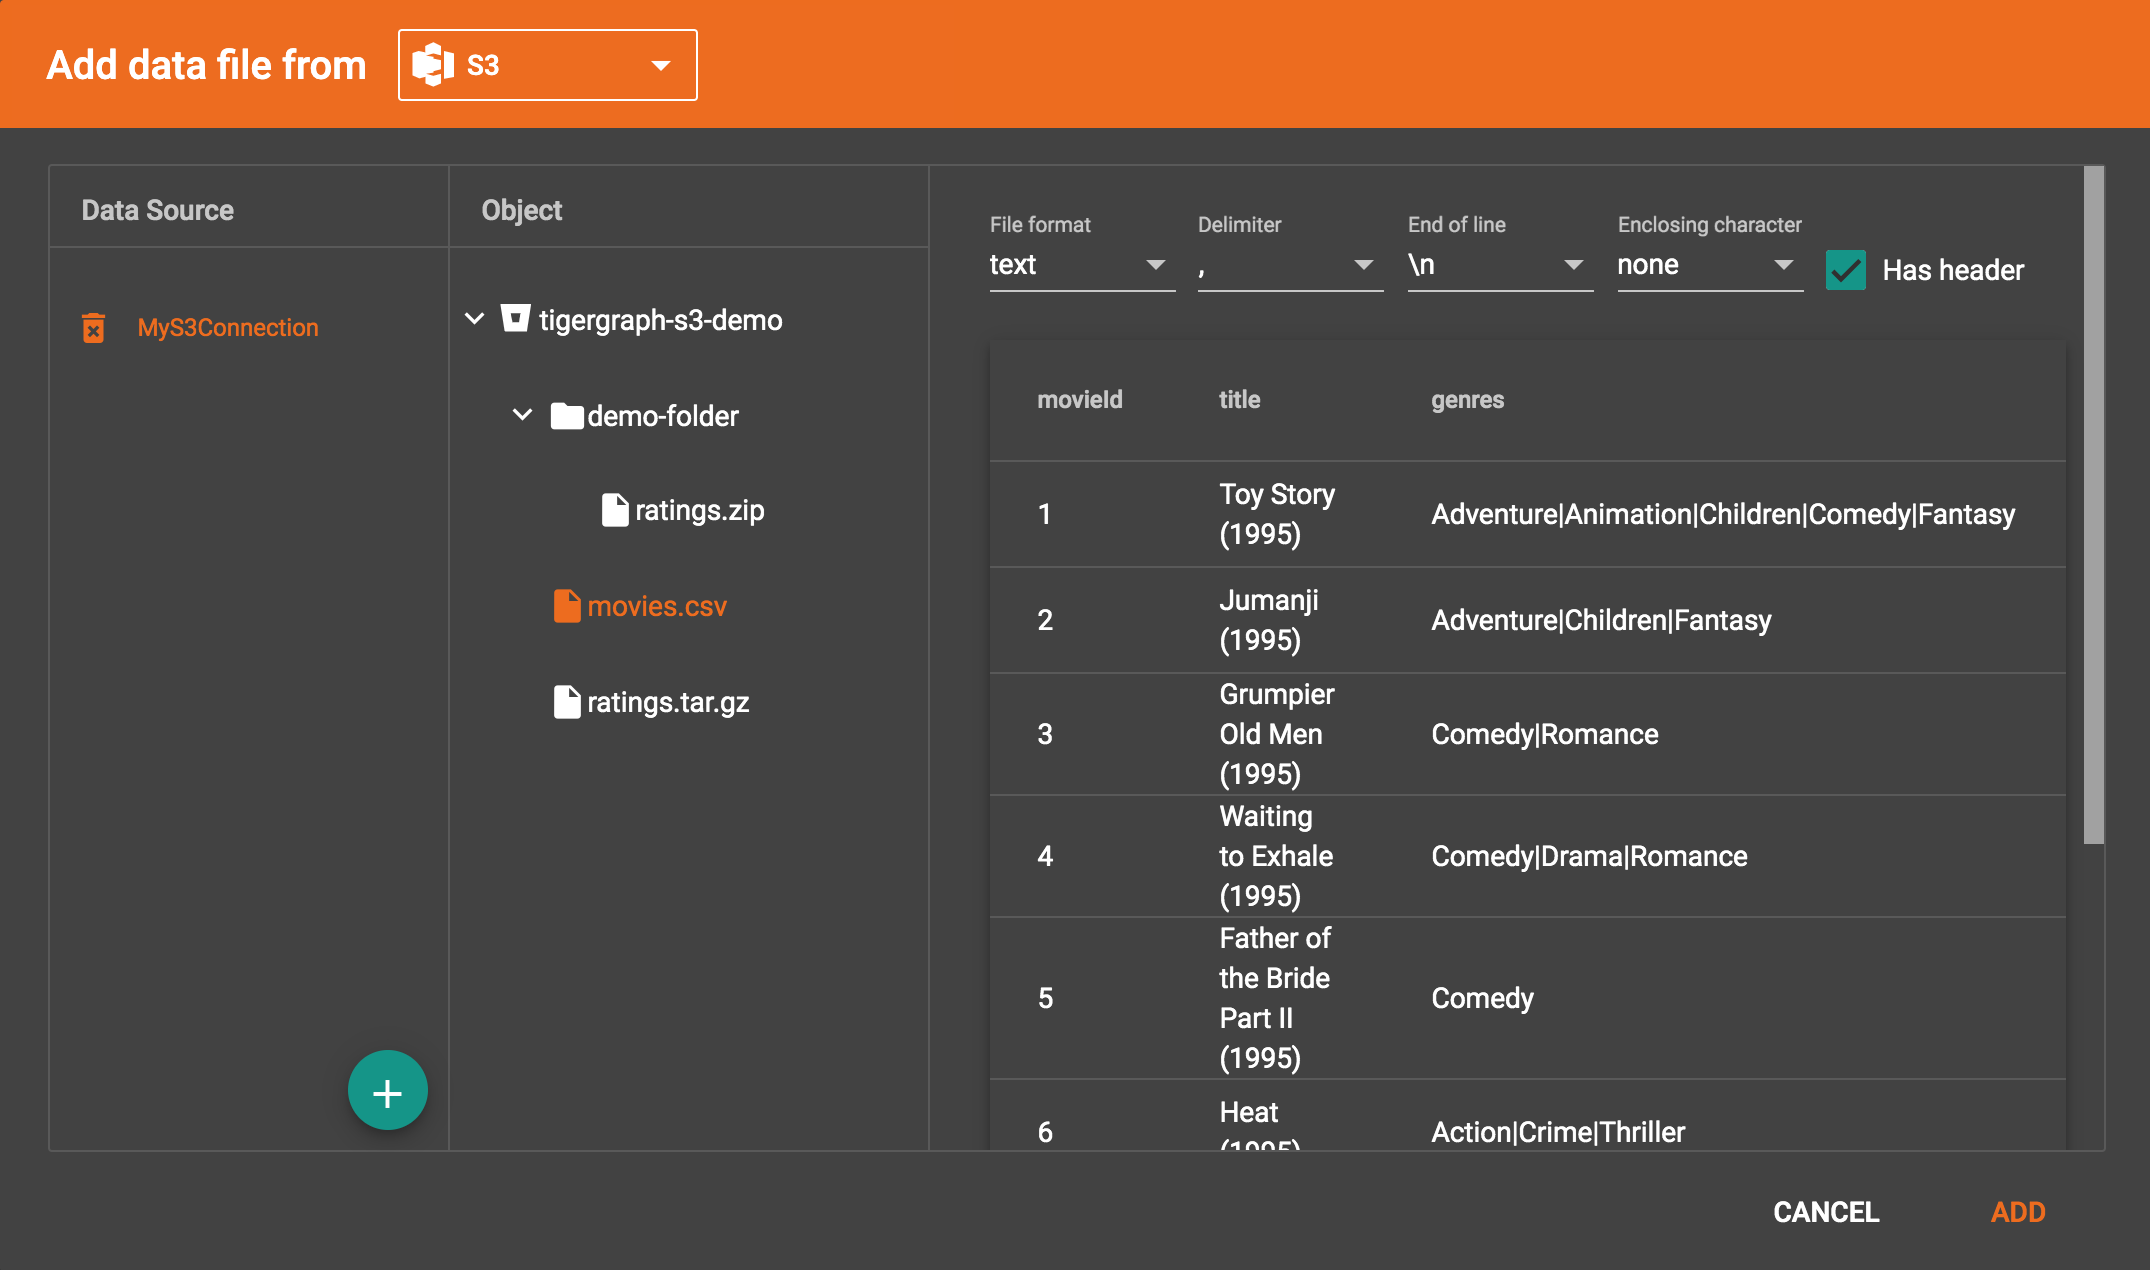
-
Confirm that the data has parsed correctly (see Configure the File Parser) and click ADD to add the data source to your project, where it will appear in the working panel.
-
Continue with Map data files to vertex type or edge type.
Create a GCS data source
After clicking Google Cloud Storage when selecting a data source type, you will be prompted to enter a custom name for your GCS data source.
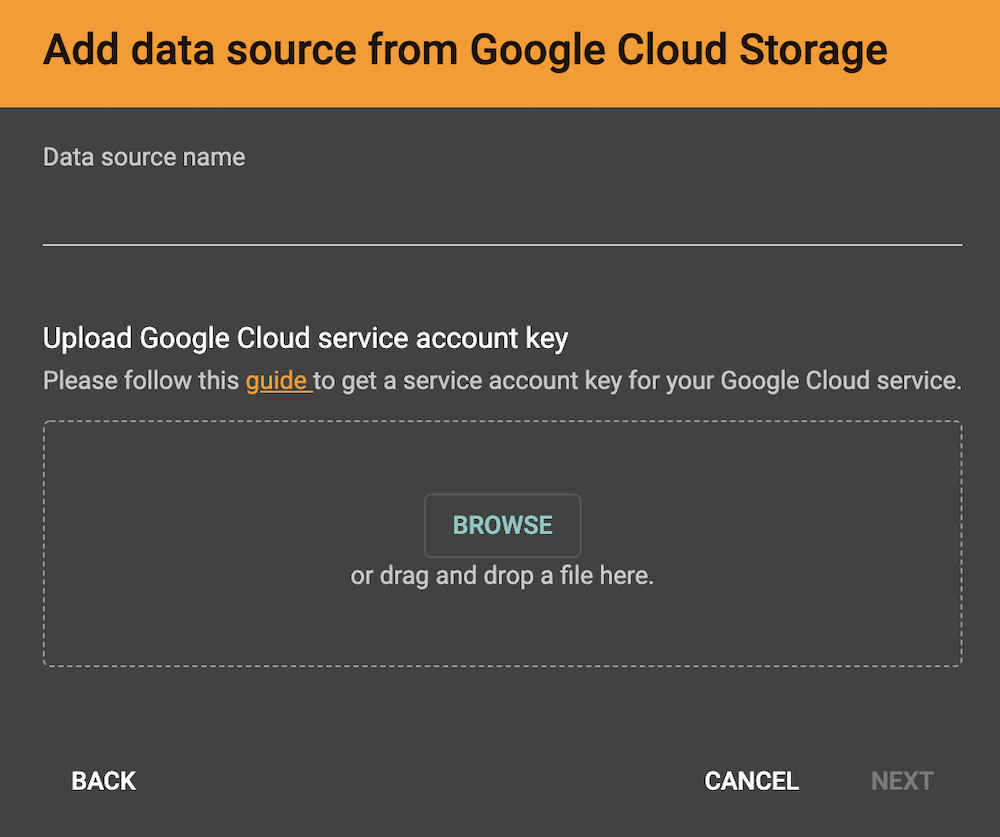
Underneath the name line, upload your GCS account key file. Google provides a guide on generating and downloading key files at this link: Getting a service account key.
After you enter your key, enter the gsutil URI for your data file in your Google Cloud Storage bucket.
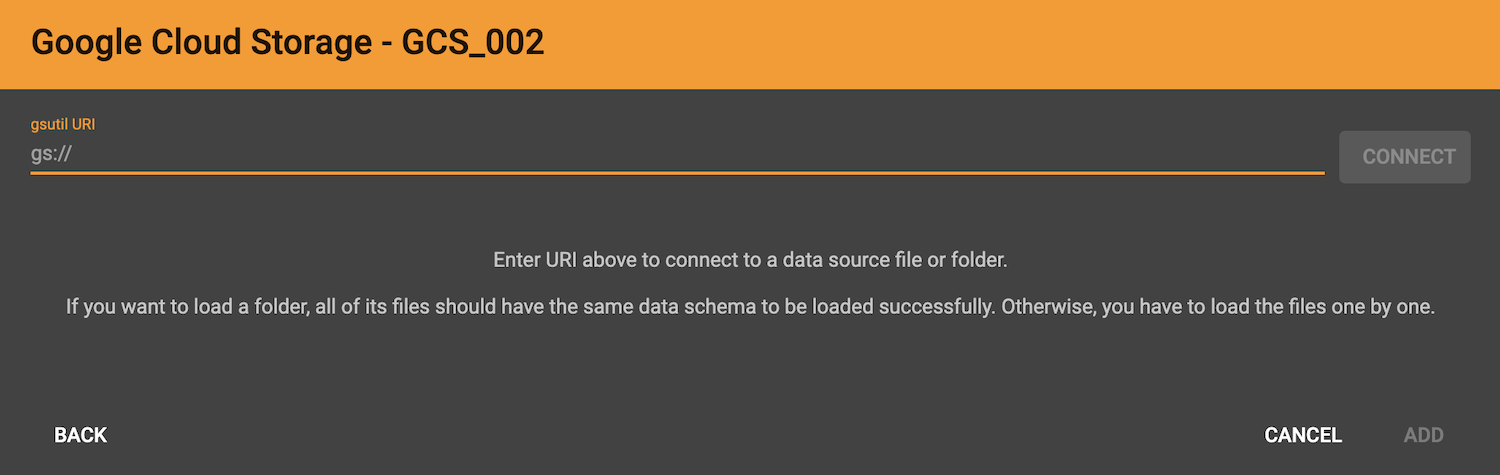
In addition to single files, TigerGraph also supports loading an entire folder by entering the gsutil URI for that folder.
All data files in this folder must share the same data schema. The folder preview, like the file preview, is limited to the first ten lines of uploaded data. If a folder contains more than one file and the first file has more than ten lines, only the first ten lines of the first file will appear in the preview.
|
TigerGraph supports loading from archived and compressed GCS files directly. Currently supported file extensions include zip, tar.gz, tgz and tar. GraphStudio detects the file extension and automatically chooses the corresponding file format. If the file is encoded with one of these formats but has a non-standard file extension, you can manually specify the file format. |
Confirm that the data has parsed correctly (see Configure the File Parser) and click ADD to add the data source to your project, where it will appear in the working panel.
Continue with Map data files to vertex type or edge type.
Load a JSON file
GraphStudio supports loading files in JSON format as well as in CSV format. Each line in the uploaded file must contain exactly one JSON object.
Similar to loading a CSV or TSV, you will first see a preview of the JSON file so that you can check the parsing.
After looking at the preview, you may edit the data key and data type for each of the JSON fields.
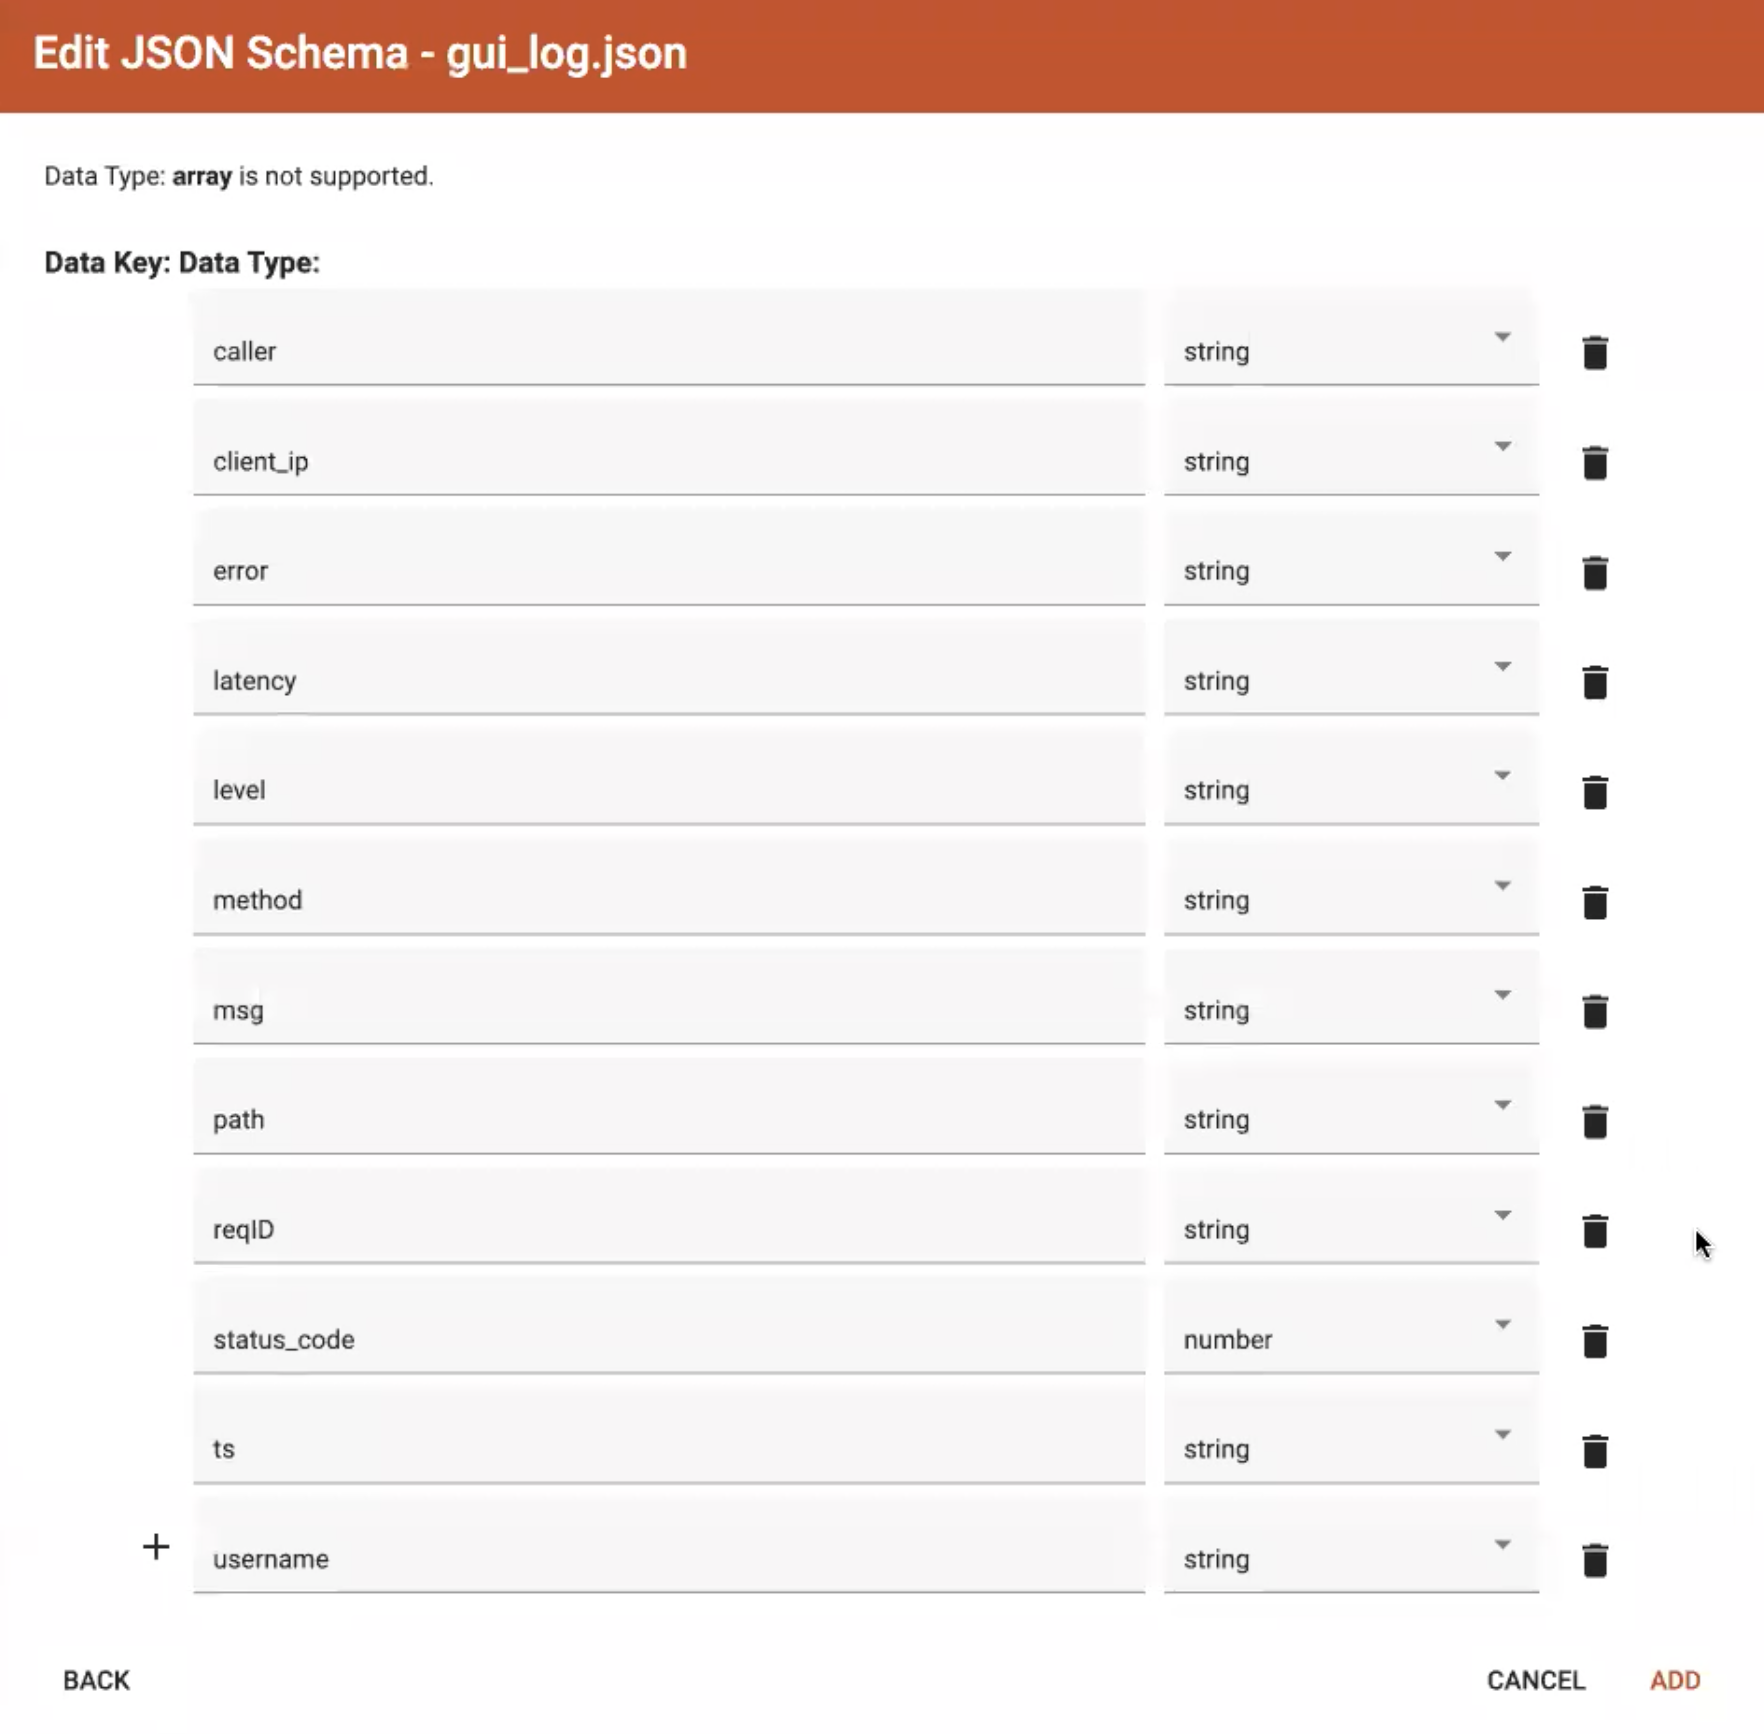
In this stage, you specify the data types for interpreting each JSON key as a potential object to load to a vertex or edge attribute. Here, you can also delete any keys that you do not want to load.
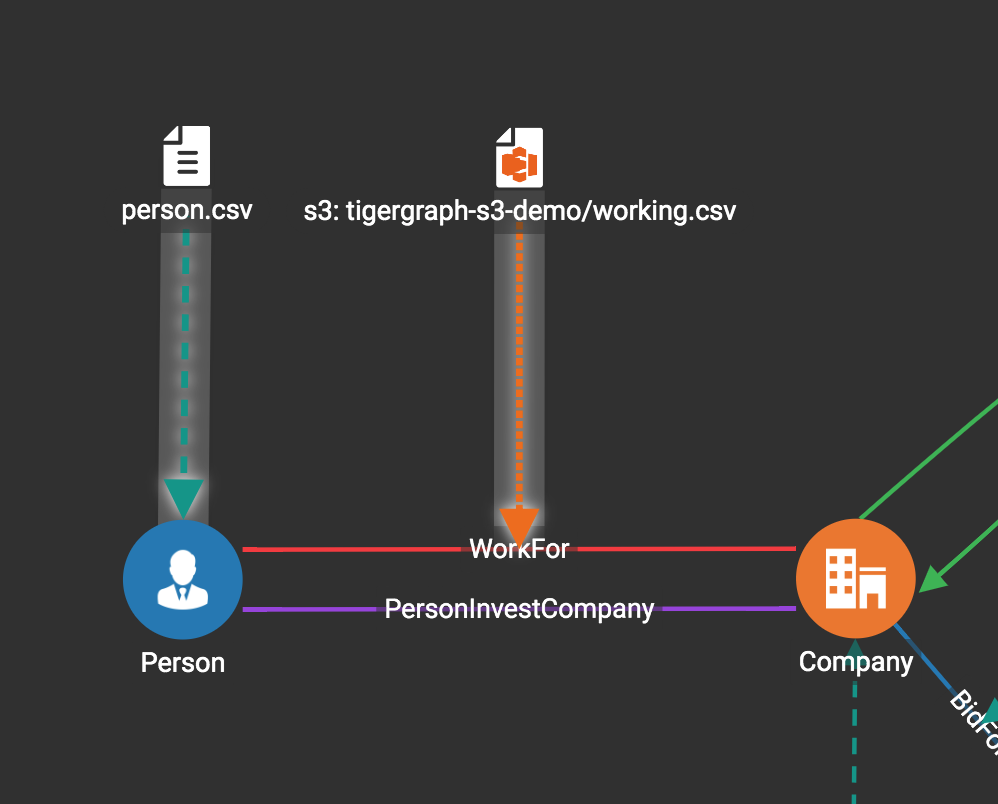
Map data files to vertex type or edge type
In this step, you link (map) a data file to a target vertex type or edge type.
The mapping can be many-to-many, which means one data file can map to multiple vertex and/or edge types, and multiple data files can map to the same vertex or edge type.
Click the map data file to vertex or edge button  to enter map data file to vertex or edge mode.
Then, click the data file icon. A hint will appear over the icon:
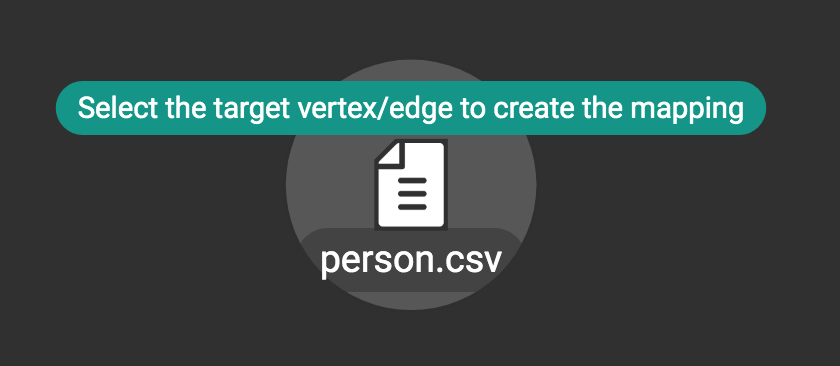
Next, click the target vertex type circle or edge type link. A dashed link will appear between the data file and the target vertex or edge type:
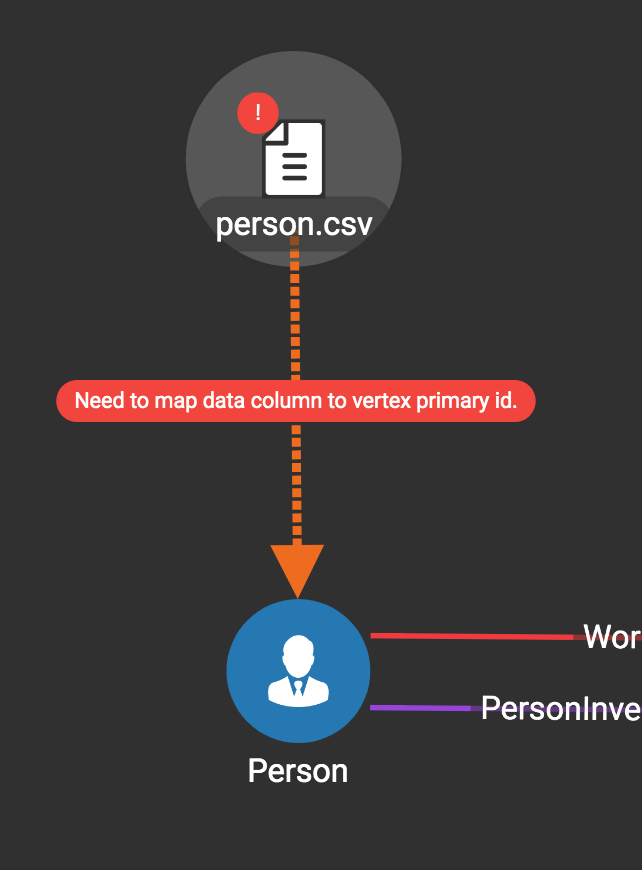
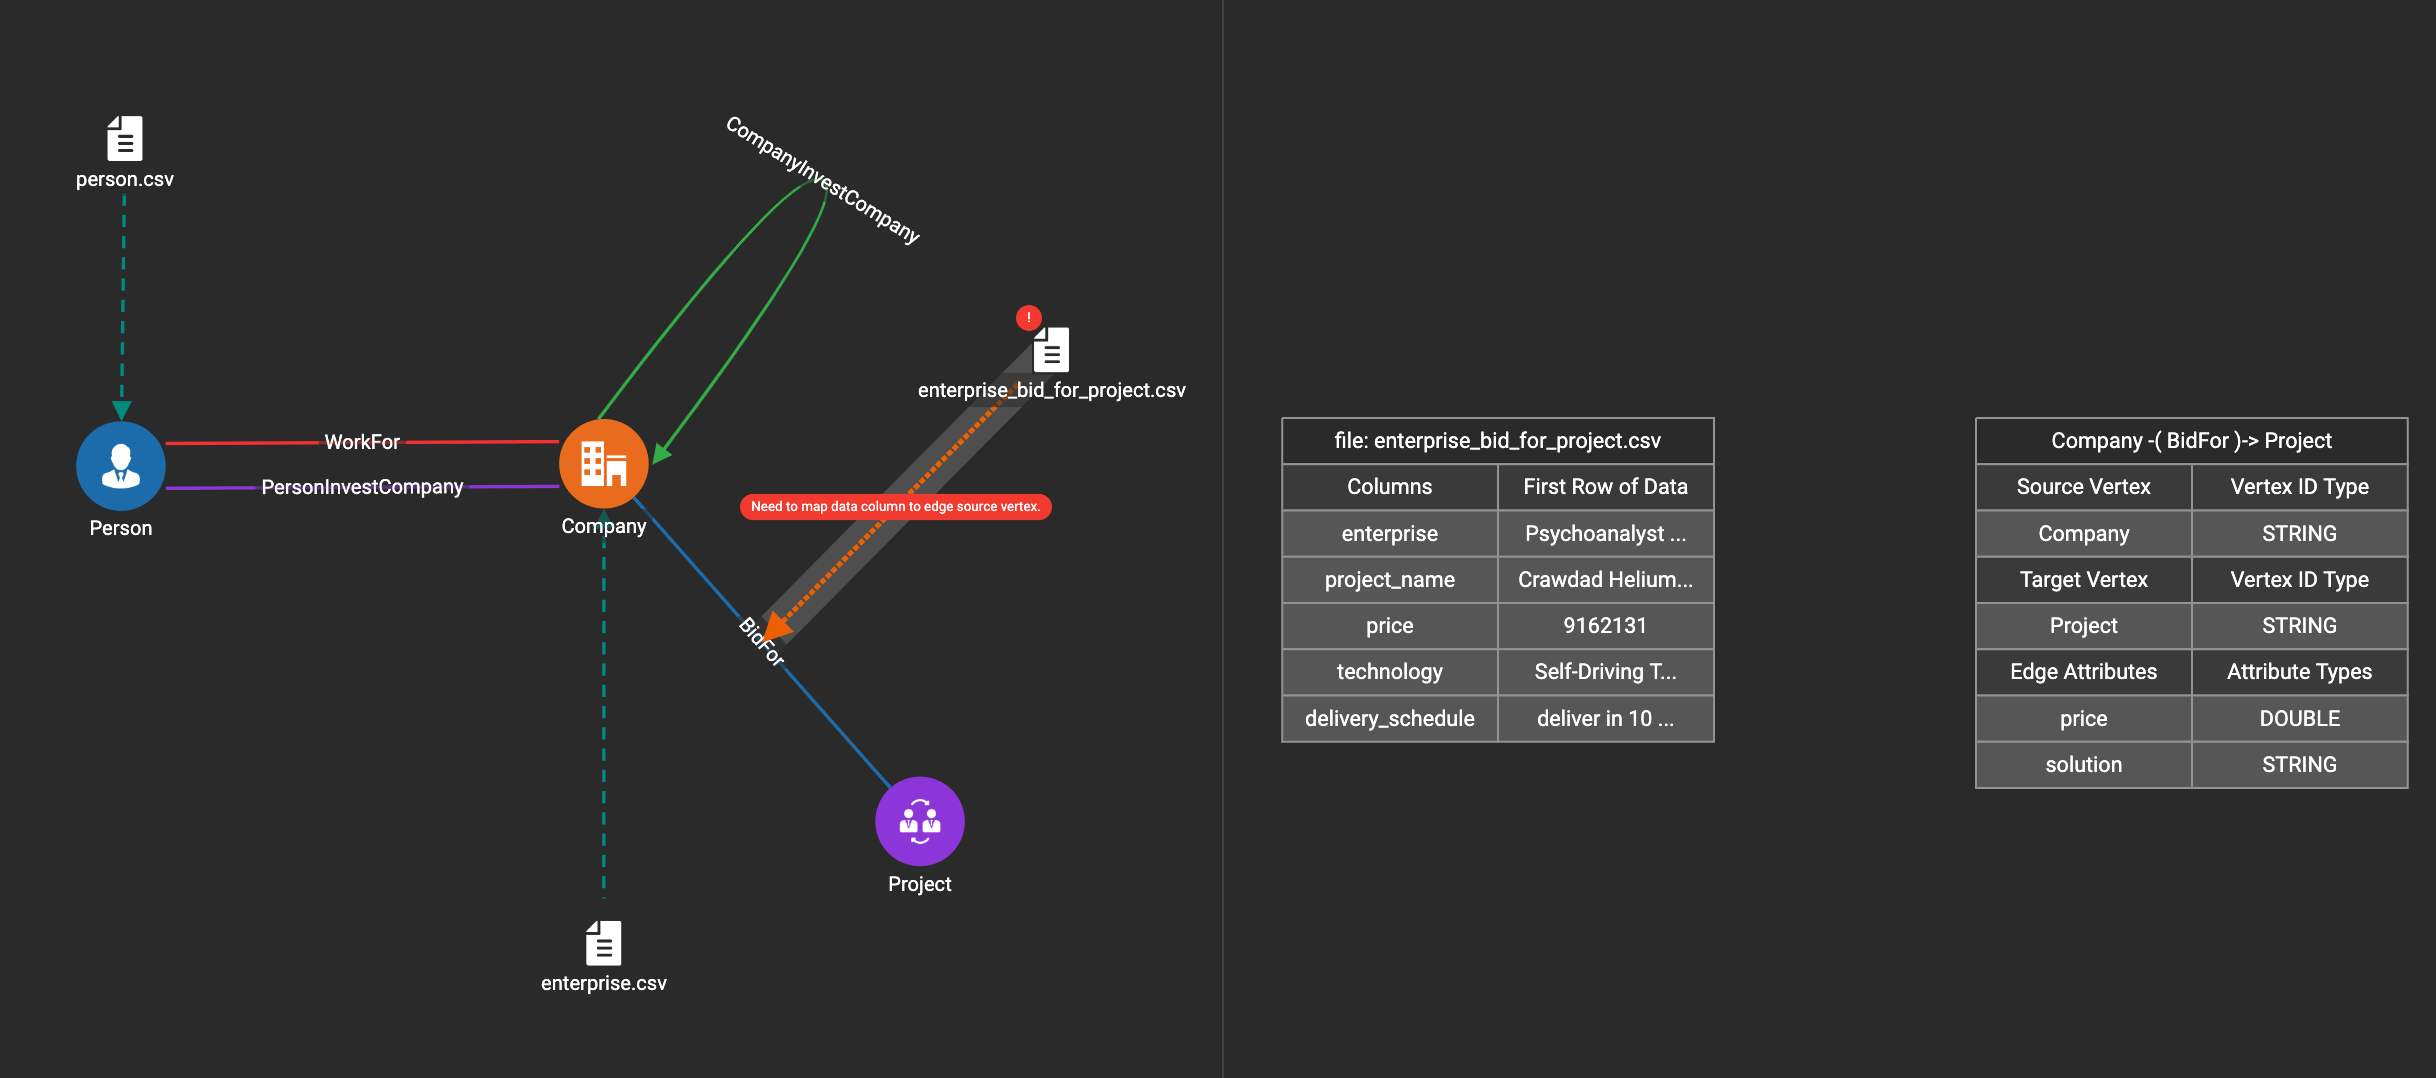
A red hint will appear if the target type has not yet received a mapping for its primary id(s).
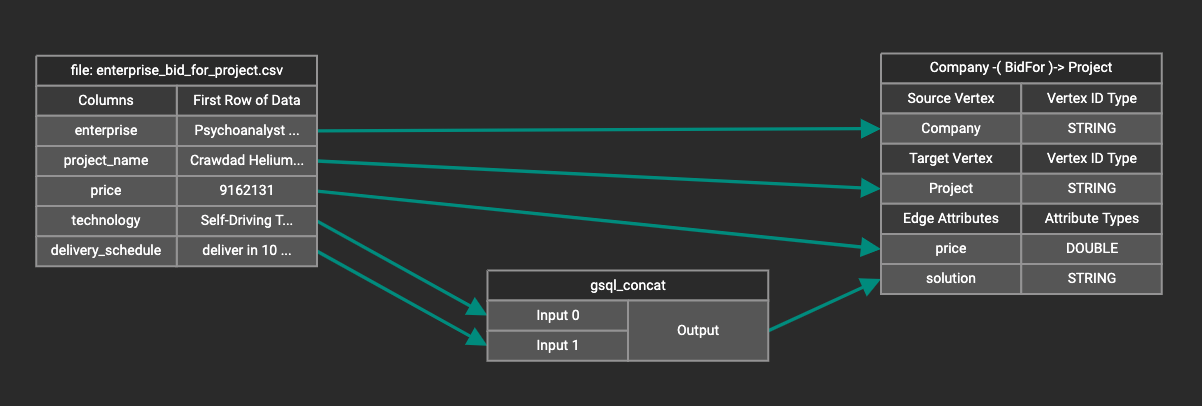
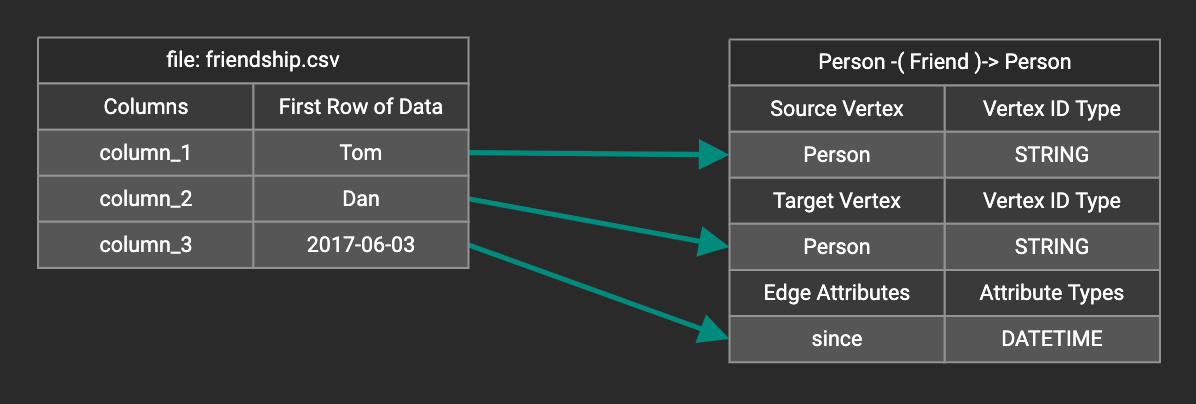
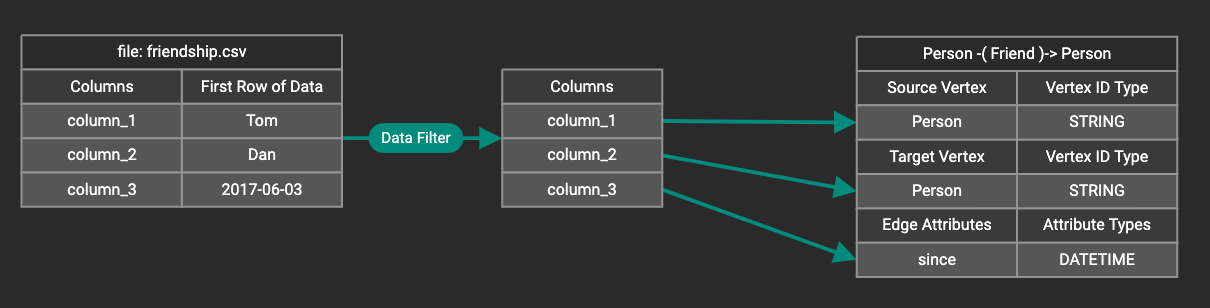
Map data columns to vertex or edge attributes
In this step, you link particular columns of a data file to particular ids or attributes of a vertex type or edge type.
First, choose one data mapping from one data file to one vertex or edge type (represented as a dashed green link on the left working panel).
When selected, the dashed line becomes orange (active), and the right working panel will show two tables with the data file and target vertex or edge fields.
Drag and drop from the left table to the right table to map the attributes to a target field. The left table contains the CSV columns or JSON keys. The target field is either an attribute of the vertex/edge, a primary id for a vertex, or a source and target id for an edge.
A green arrow appears to show the mapping.
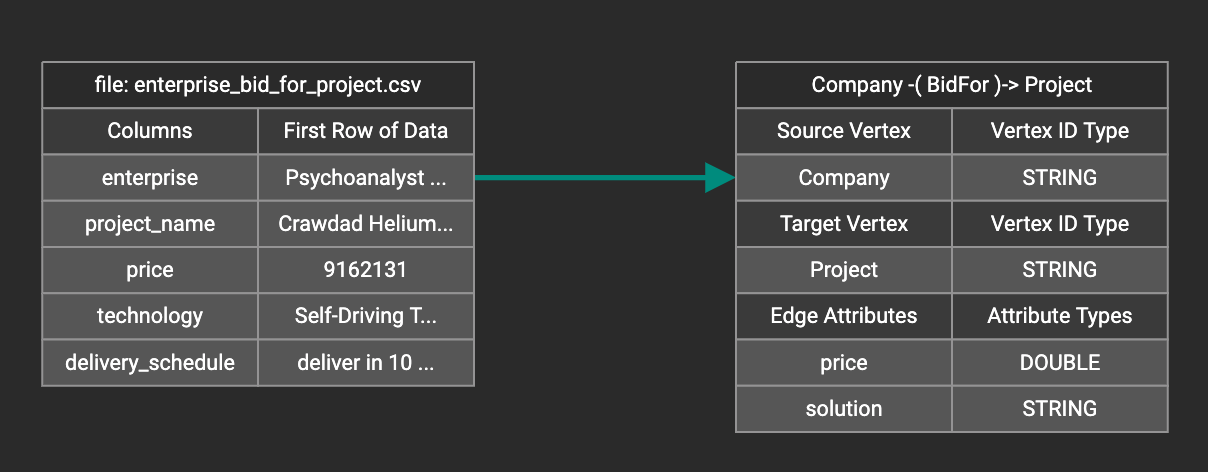
Repeat as needed to create all the mappings for this table-to-vertex/edge pair. Since many-to-one mapping is allowed, it is not necessary for one table to provide a mapping for every field in the target vertex/edge.
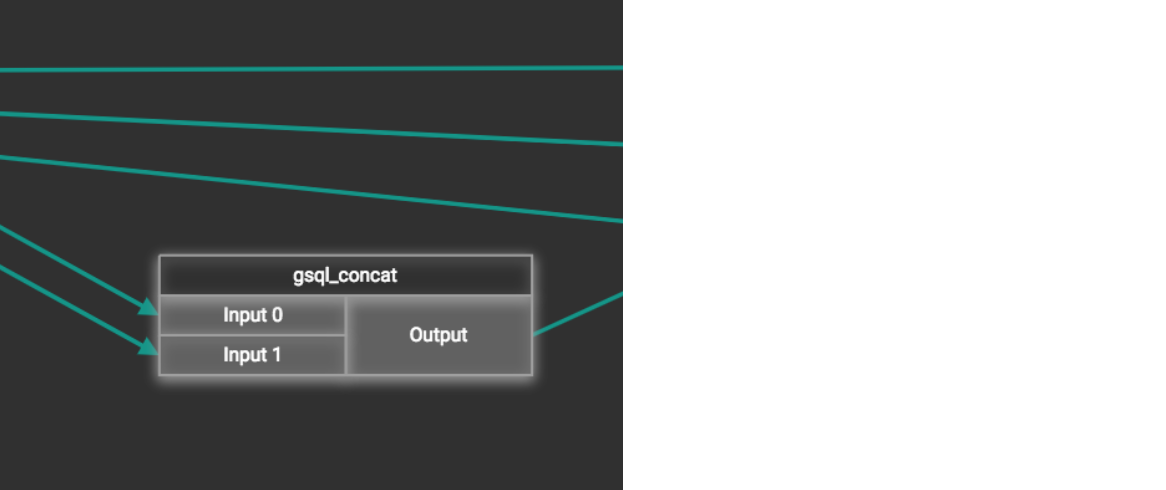
Using a Token Function
GraphStudio gives you access to both a set of built-in functions and user-defined token functions to preprocess data file tokens before loading them in to the graph. For example, you can concatenate two columns in the data file and load them as an attribute. This section describes how to use these token functions.
Click the add token function button  to open the Add Token Function window. Select a token function from the drop-down list under Function name, then click the ADD button.
For some functions, you may also specify the number of input parameters. (Most token functions have a fixed number of input parameters; gsql_concat can accept any positive number of inputs).
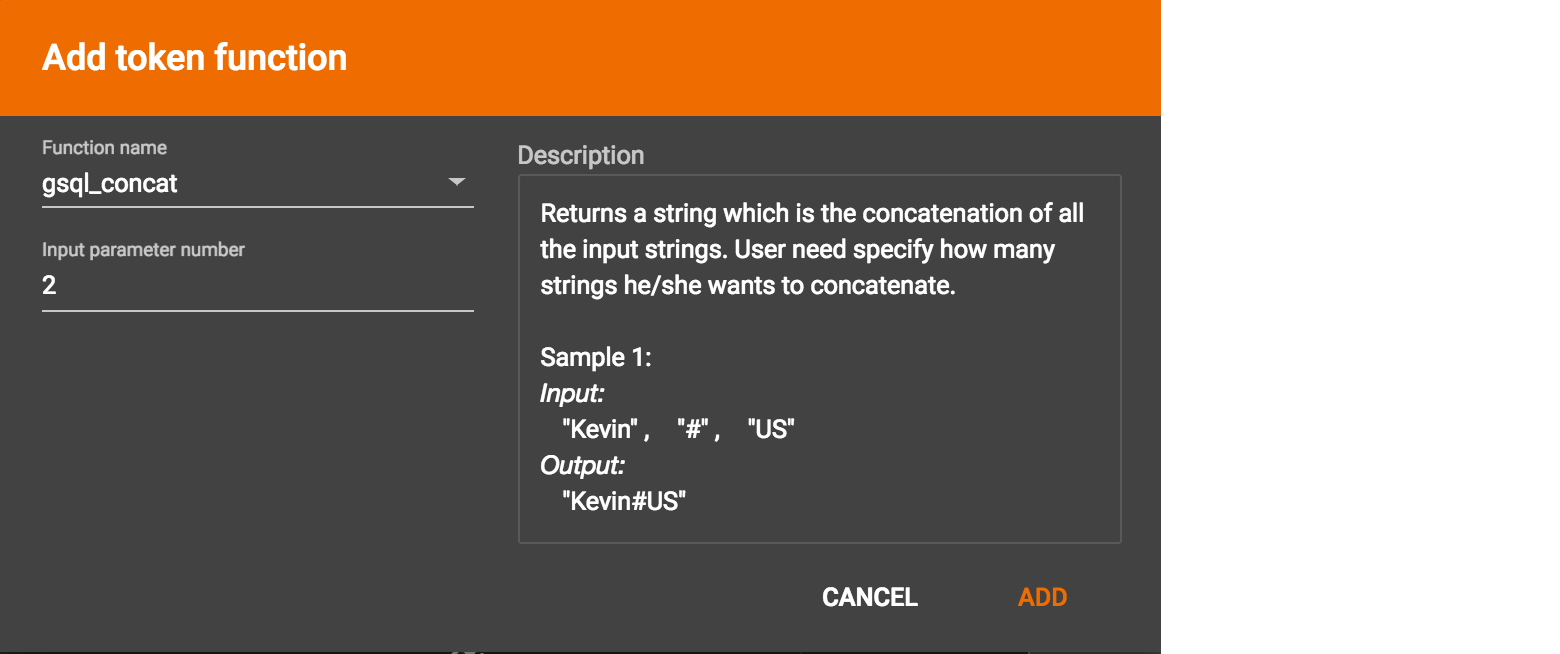
GraphStudio currently does not support creating new user-defined functions. If a user-defined function has been added via the GSQL interface, it will be listed here. To use a user-defined token function, you must manually specify the number of input parameters. The C++ code is shown in the Description section for your reference:
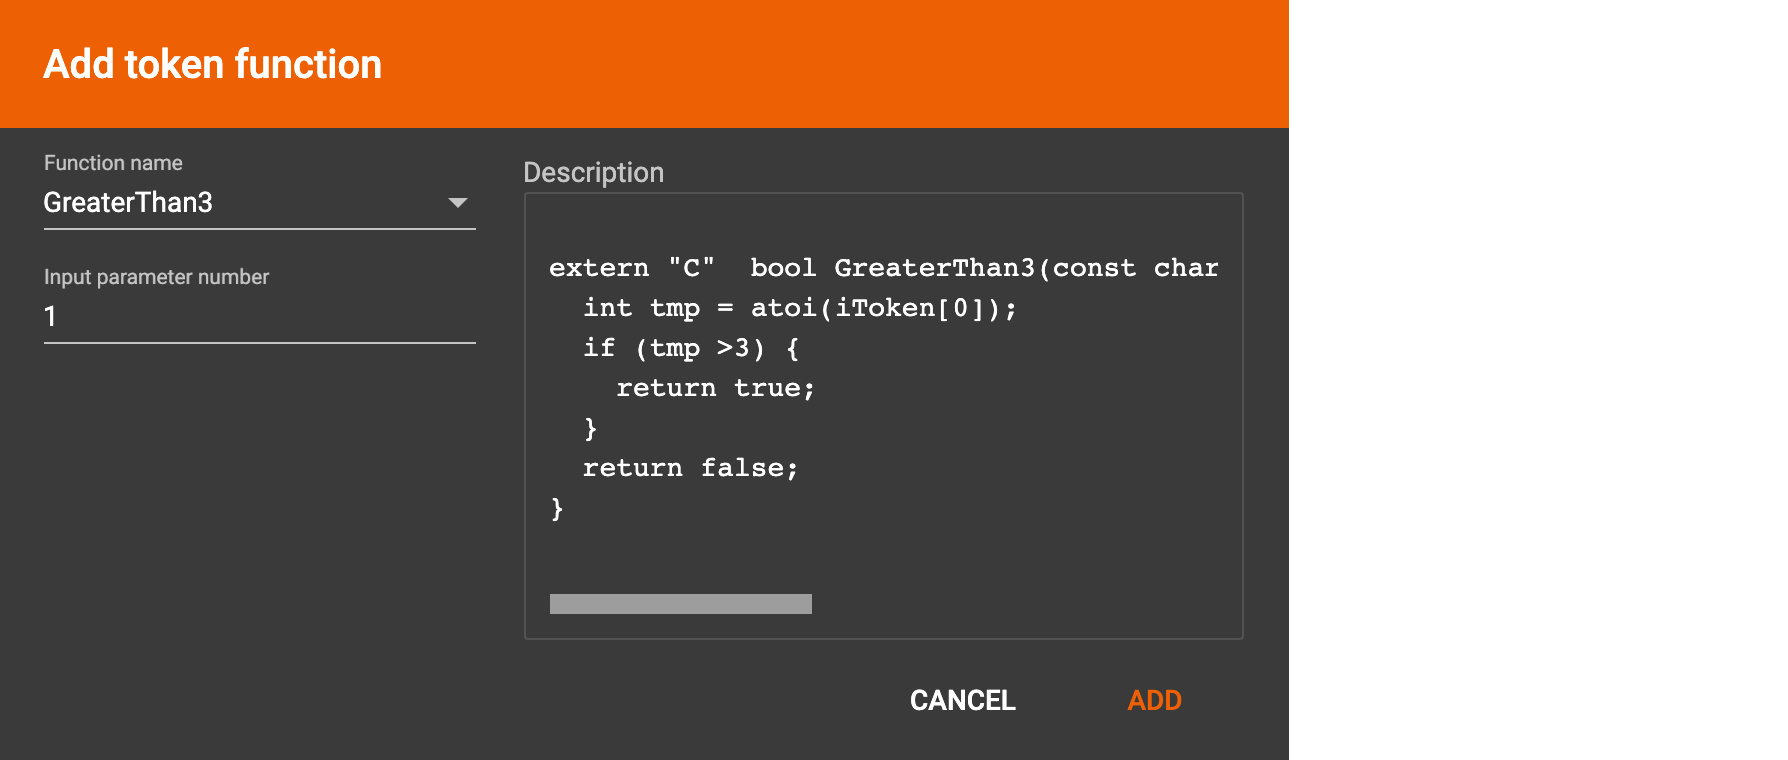
A token function table will be added to the attribute mapping panel.
Token functions act as intermediate steps in the mapping. Create mappings from the data file table to the token function table, and then from the token function table to the vertex/attribute table.
Auto Mapping
If the data file columns and the vertex/edge attributes have very similar names (only capitalization and hyphen differences), you can click the auto mapping button  . All similar columns will be mapped automatically.
Map a constant value to an attribute or token function input
Sometimes, a user may need to load a constant value to an id or attribute. Here we show how to do this in GraphStudio.
Loading a constant to an attribute
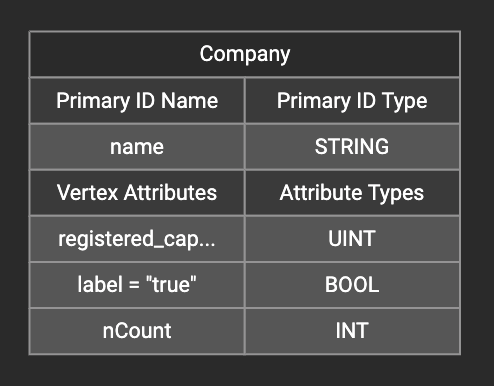
In the right working panel, double-click on the target id or attribute in the left column of the right table. In the example below, the attribute "label" has been double-clicked:
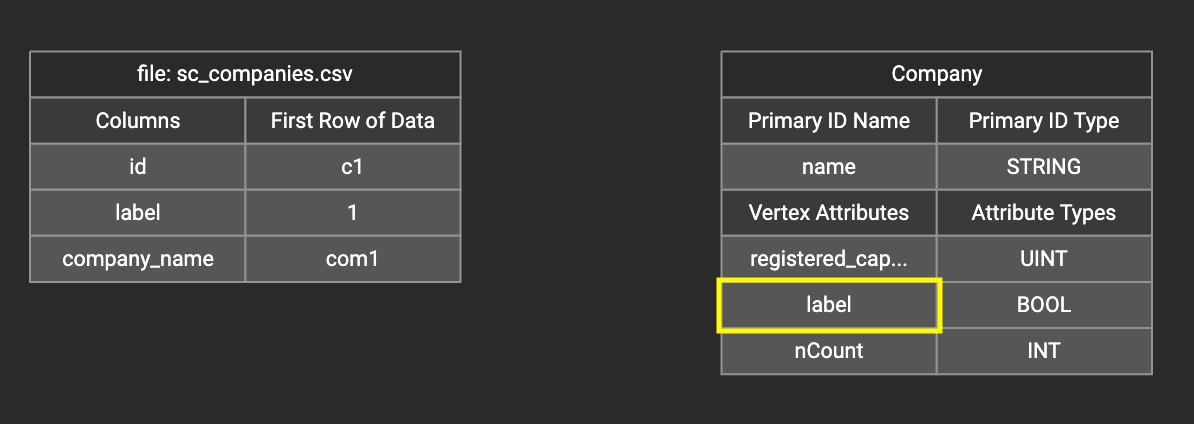
This will cause the Load Constant window to pop up. Type in the constant value, and click the Add button to apply the mapping.
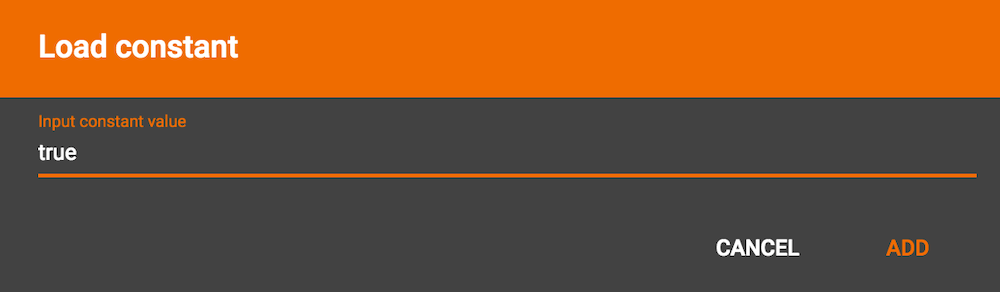
After adding the constant value, the attribute’s label will change to id/attribute = "(your valid input value)" .
To modify or remove a constant mapping, double-click the id/attribute again. In the Load Constant window, enter the new value, or erase the value if you want to remove the mapping. Click the Add button to apply.
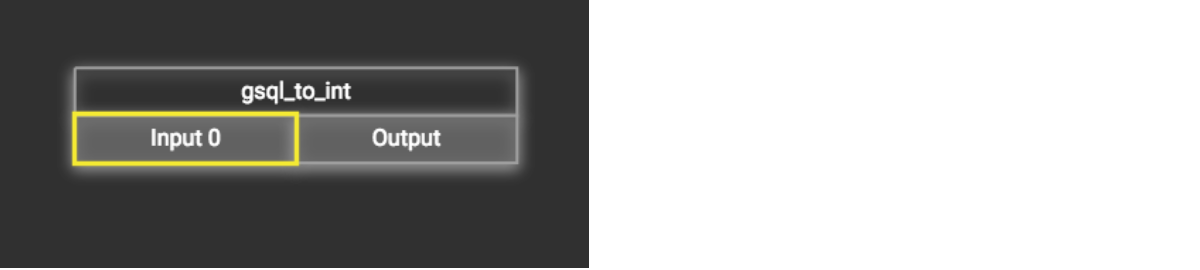
Use a constant input for a token function
First add the token function. Then double-click on the target input (in the left column of the token function table). In the example below, "Input 0" has been double-clicked.
This will cause the Load Constant window to pop up. Type in the constant value and click the Add button to apply the mapping. After adding the constant value, the input’s label will change to Input = "(your input value)" .
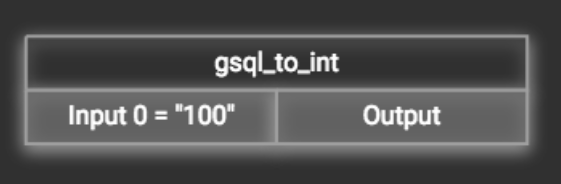
The constant value can be modified or removed by double-clicking the label and editing the value in the Load Constant window.
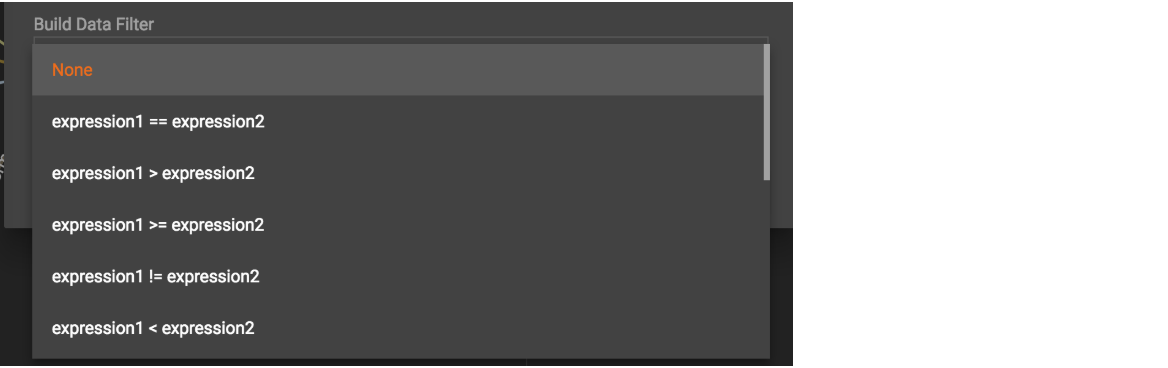
Add data filter
You can add a data filter to a data mapping so that only data records which meet conditions that you specify will be loaded into the graph.
This is equivalent to the WHERE clause in a GSQL load statement.
You can add one data filter for each data mapping from a data file to a vertex type or edge type, and the data filter only applies to that one mapping. Consider this data mapping:
By default, there is no data filter. Click the Data Filter button %20(1)%20(2).png) to start creating a data filter. The Add Data Filter window will appear. The window contains three parts:
to start creating a data filter. The Add Data Filter window will appear. The window contains three parts:
-
The top section shows one row of sample data from your file, as a handy reference to the file’s contents.
-
The middle sections shows what the data filter looks like when it is converted a to GSQL WHERE clause. For more details, see the WHERE Clause section in the GSQL Language Reference Part 1 - Defining Graphs and Loading Data
-
The bottom section is where you define your data filter. The data filter will be converted to a GSQL WHERE clause and shown in real time.
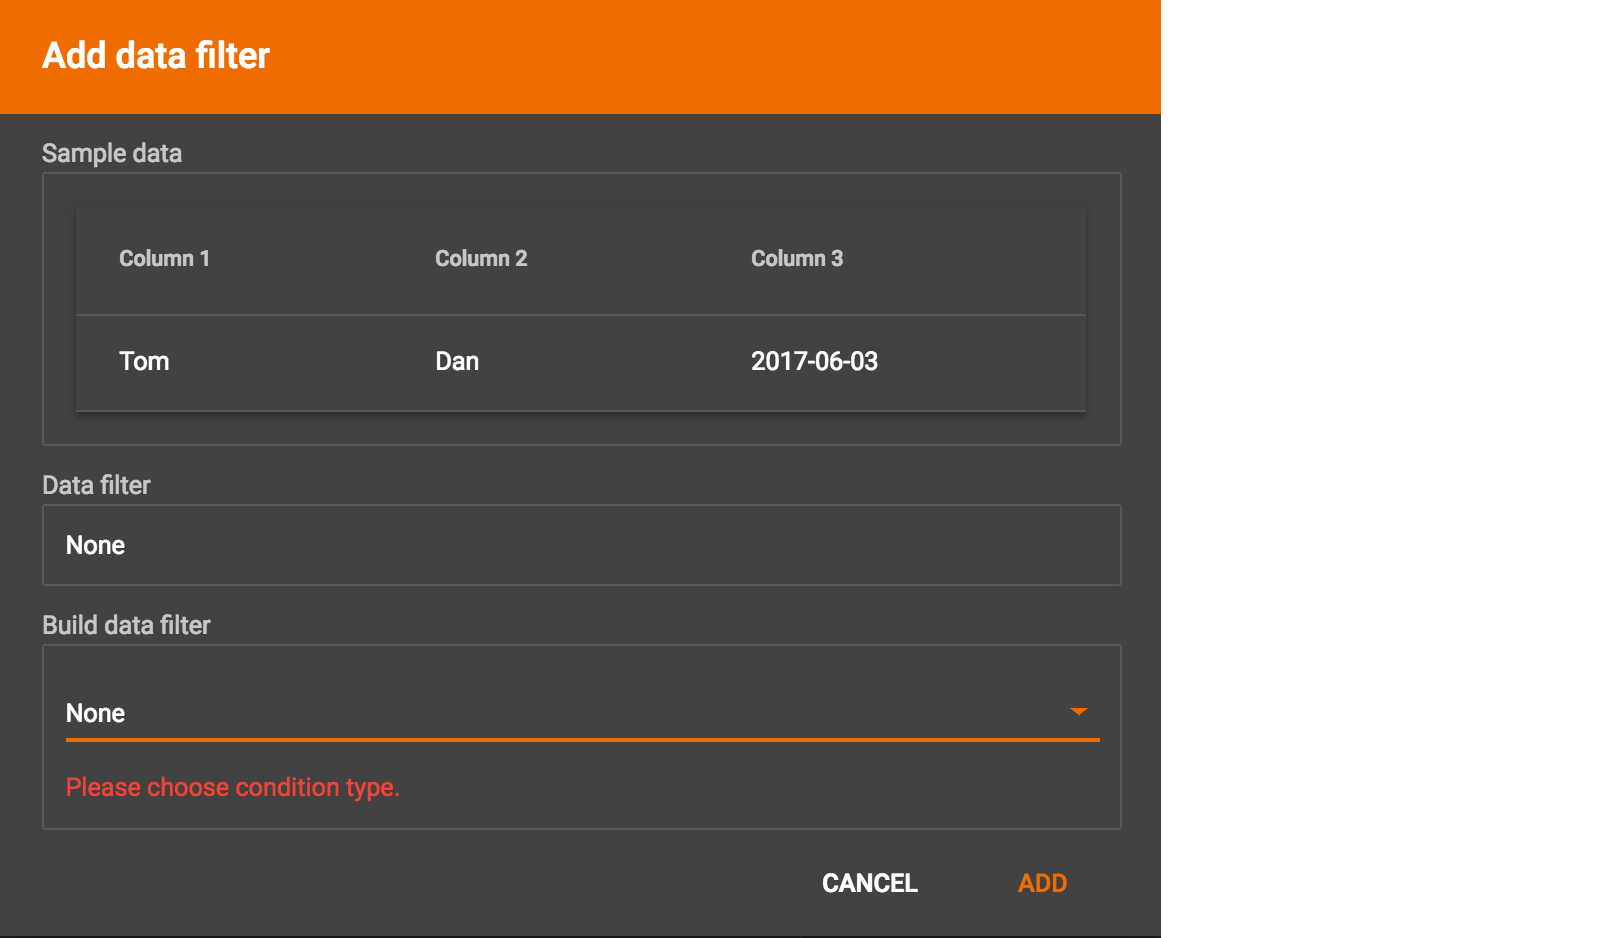
A data filter condition is a Boolean expression, which can be a nested set of conditions. TigerGraph data loader evaluates the condition for each line in your input file. If the condition evaluates to be true, then the line of data is loaded.
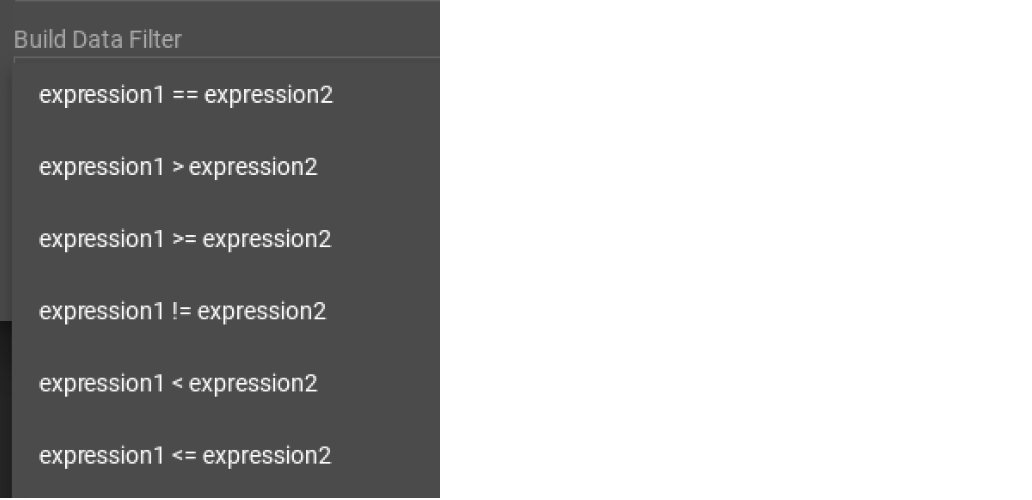
First, click the Build Data Filter chooser (with default value "None"). A menu will appear, with many Boolean expression templates. Choose one of the options. If you plan to build a nested condition, start with your top level. The first several options are for comparison expressions:
After this are several more options, using operators such as AND, OR, NOT, IN, BETWEEN…AND, IS NUMERIC, and IS EMPTY.
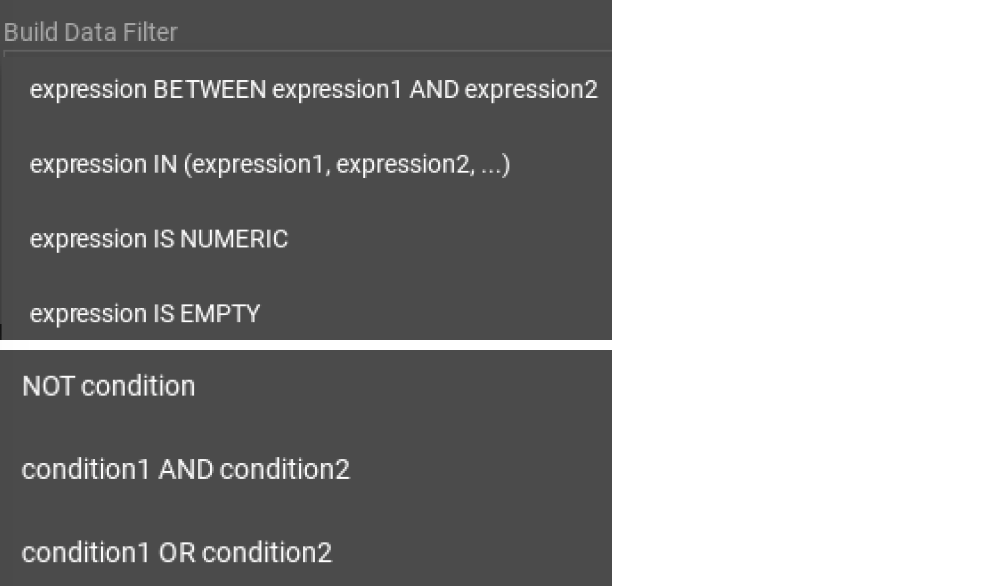
Note that each of these expressions calls for 1, 2, 3, or a list of operands, and the operands themselves can be expressions. When you select an expression, additional choosers will appear below for you to specify the operand expressions. The operand choices are context-sensitive, but typically they include
-
a Data Column from the input file
-
A constant value
-
If the operator is AND, OR, or NOT, then the operand can be another condition. Thus is how conditions can be nested.
Suppose you are loading friendship edges where the input data fields are (person1, person2, friendship_start_date). You want to load only the records where person1 is Tom and the friendship began on or before 2017-06-10. The data filter looks like the following:
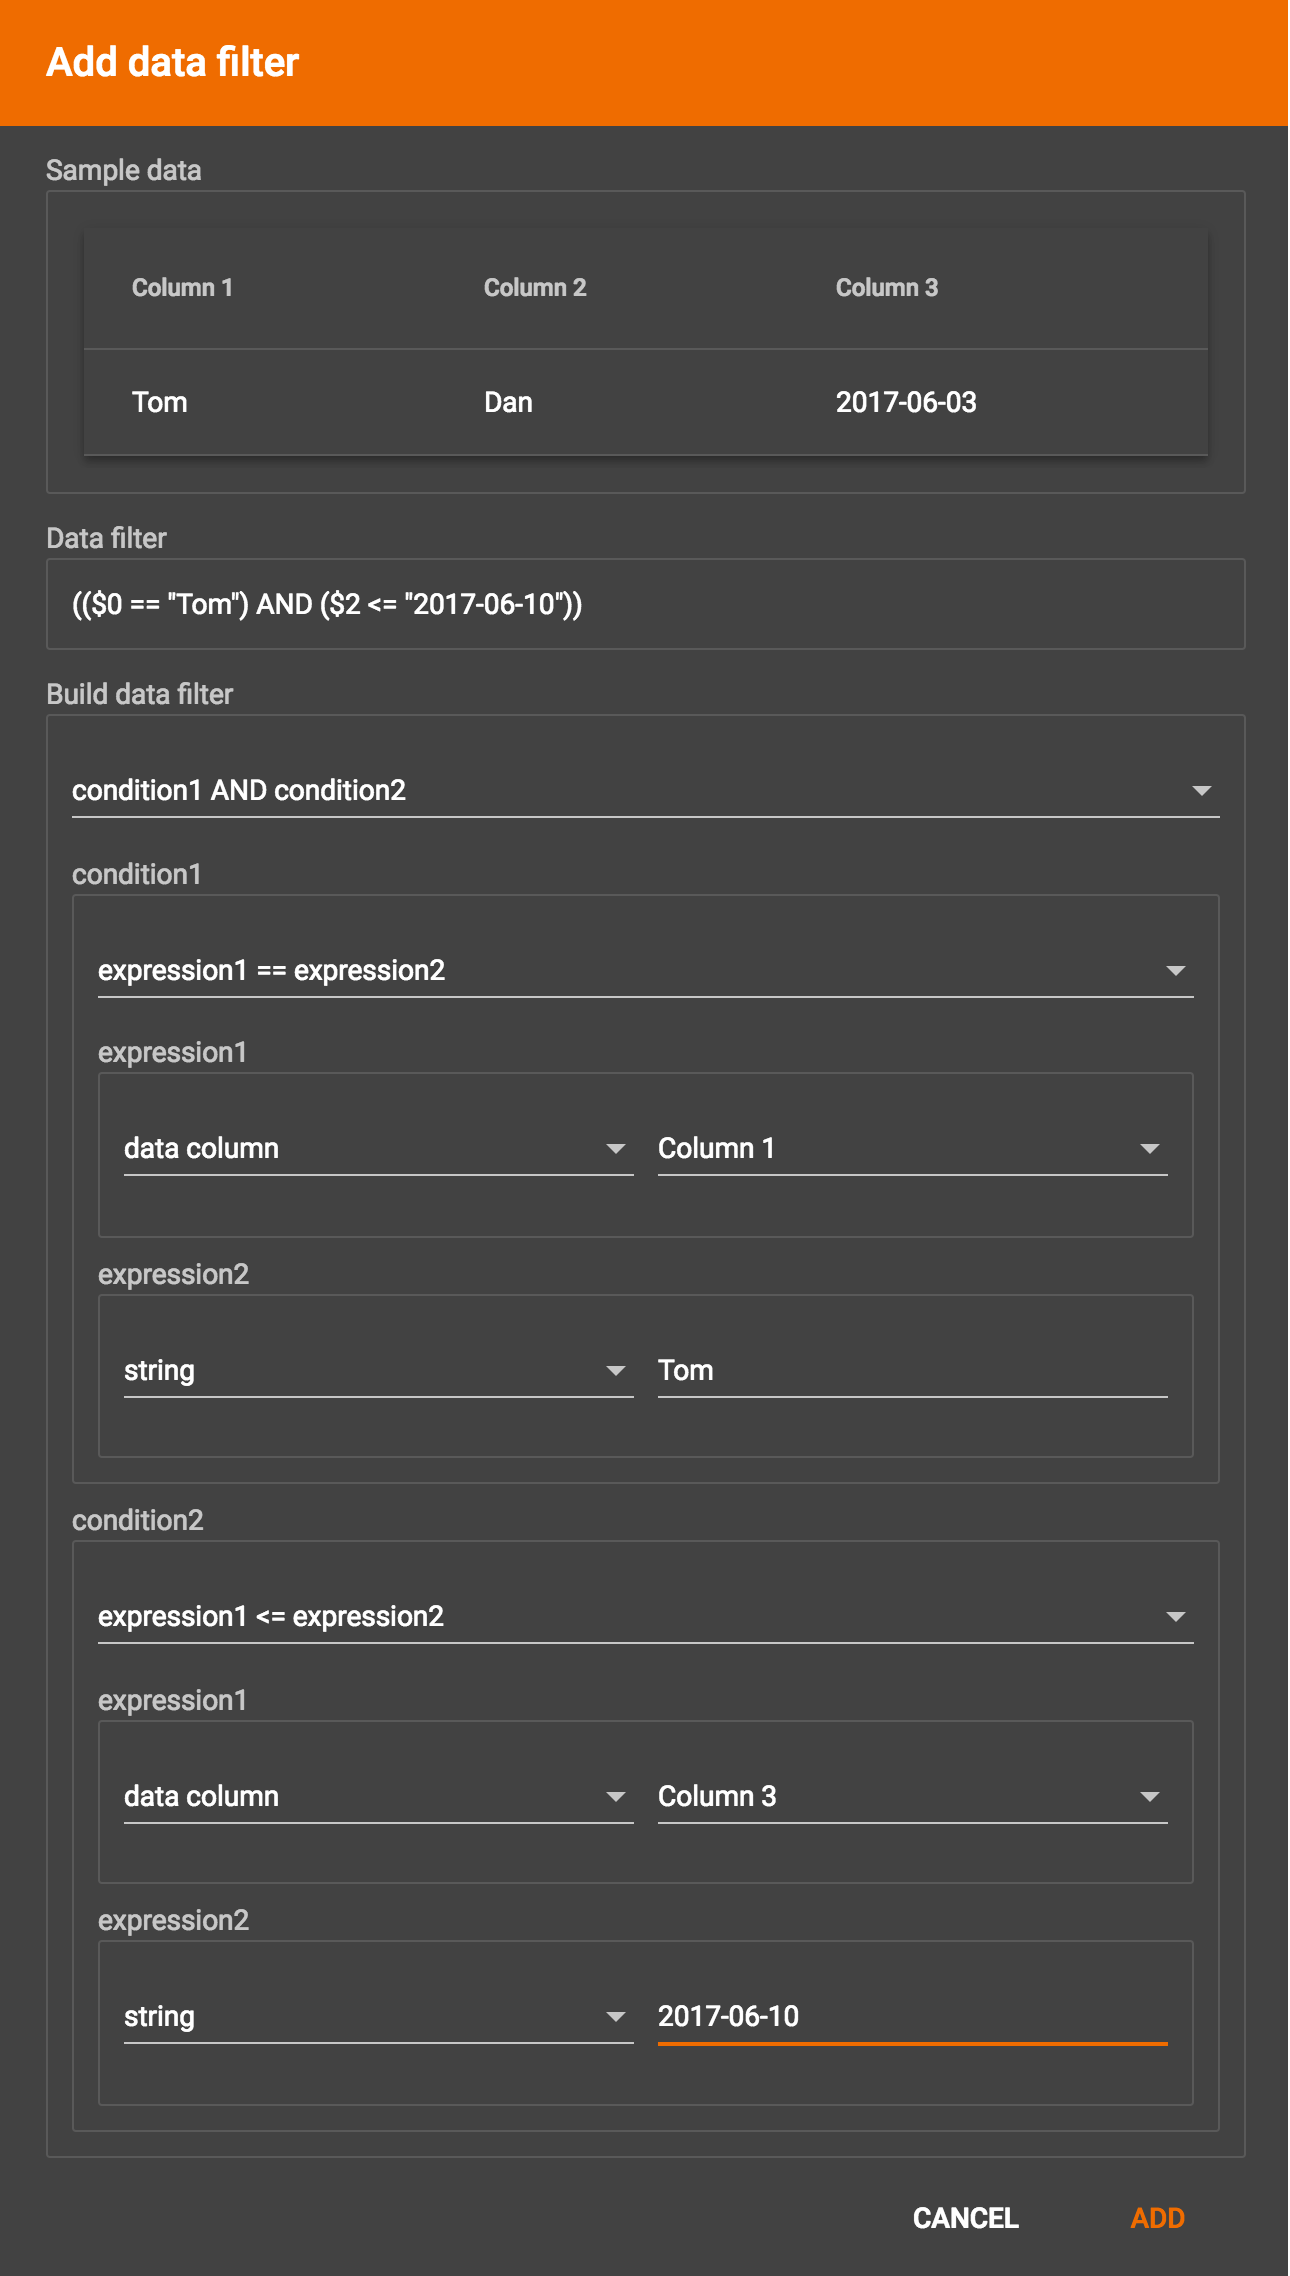
After adding the data filter, the right working panel will look like this:
Hovering the mouse over the data filter indicator  will make the data filter condition appear. If you want to modify the data filter, click the Data Filter
button or double-click the data filter indicator.
The Add Data Filter panel will appear.
will make the data filter condition appear. If you want to modify the data filter, click the Data Filter
button or double-click the data filter indicator.
The Add Data Filter panel will appear.
To remove a data filter, select "None" at the top level dropdown of the Build Data Filter section and then click ADD. The data filter will be deleted.
Advanced Features
More advanced data mapping features are grouped in the dropdown list in the three-dot menu  .
.
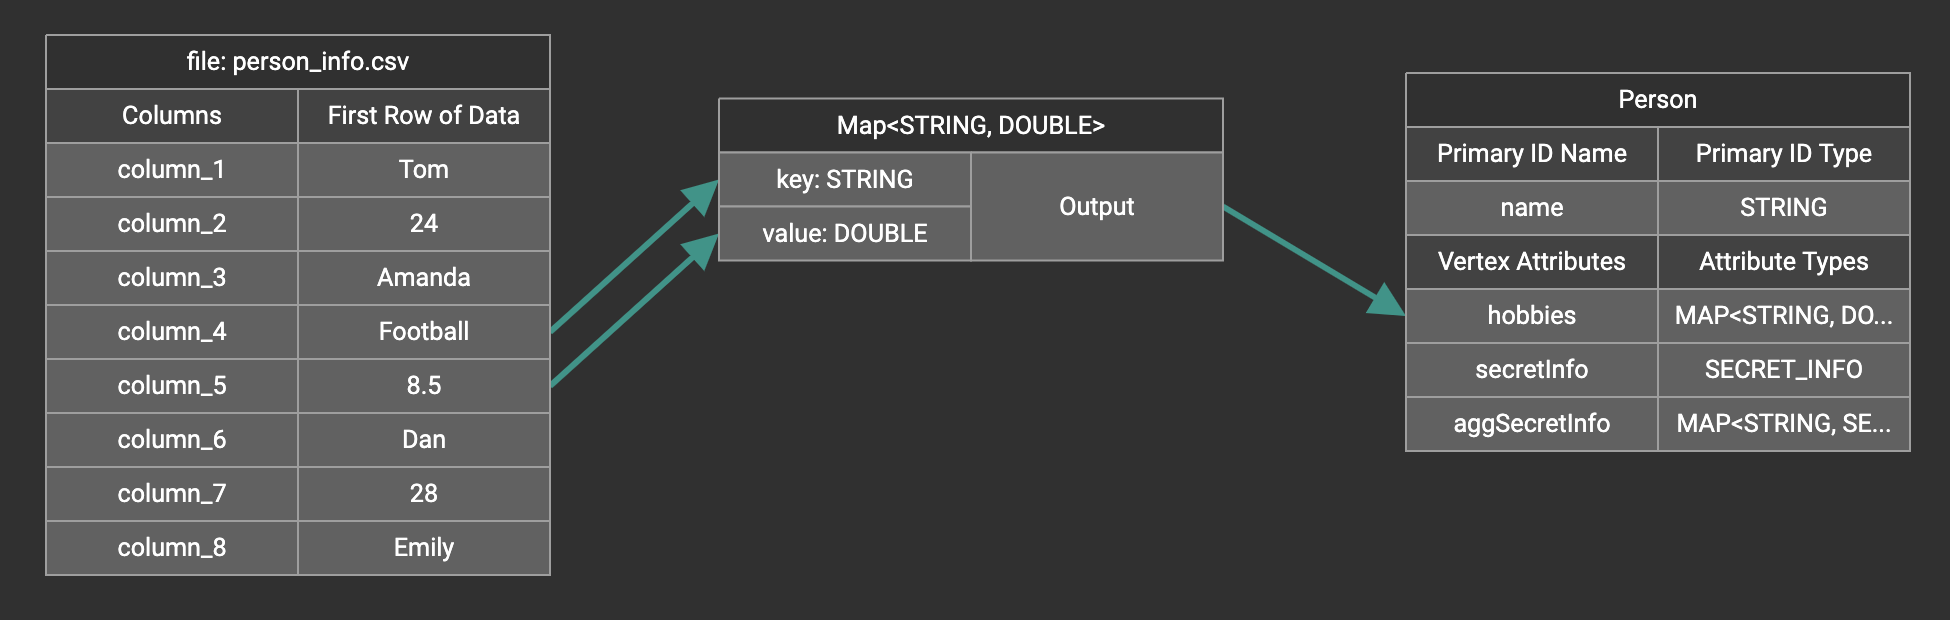
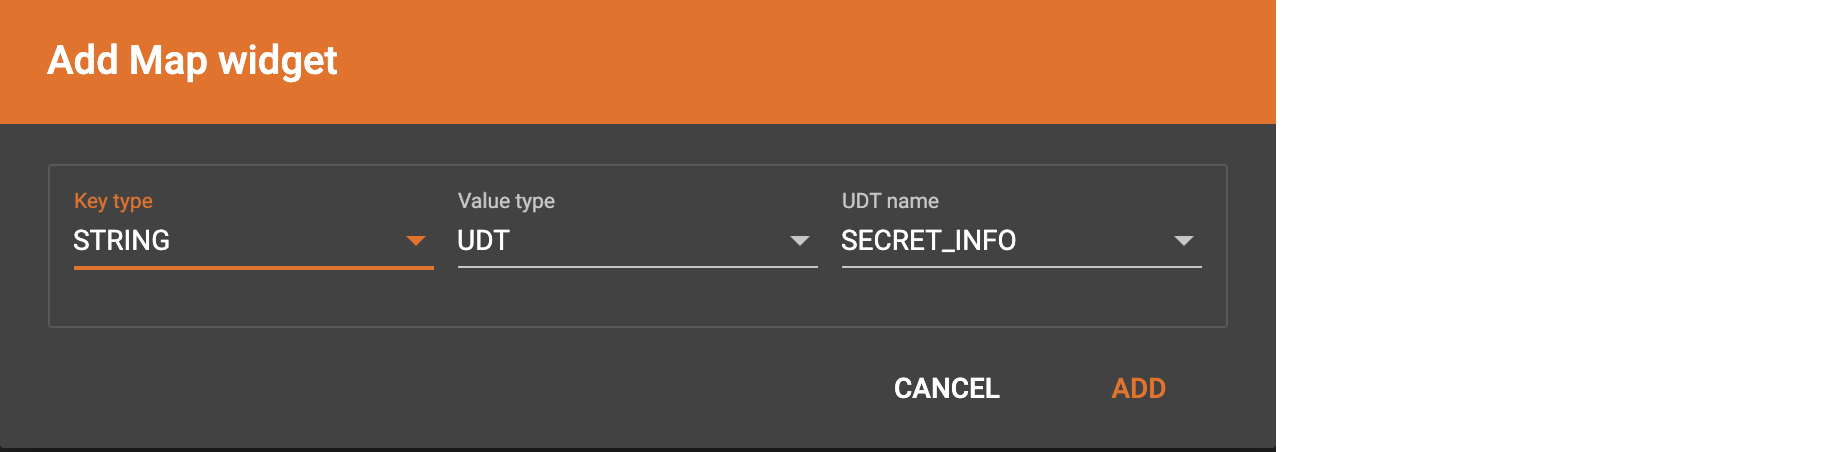
Map data to a map type attribute
Click  in the dropdown list, then choose key type and value type.
The types must match the key type and value type of the attribute you are mapping towards.
in the dropdown list, then choose key type and value type.
The types must match the key type and value type of the attribute you are mapping towards.
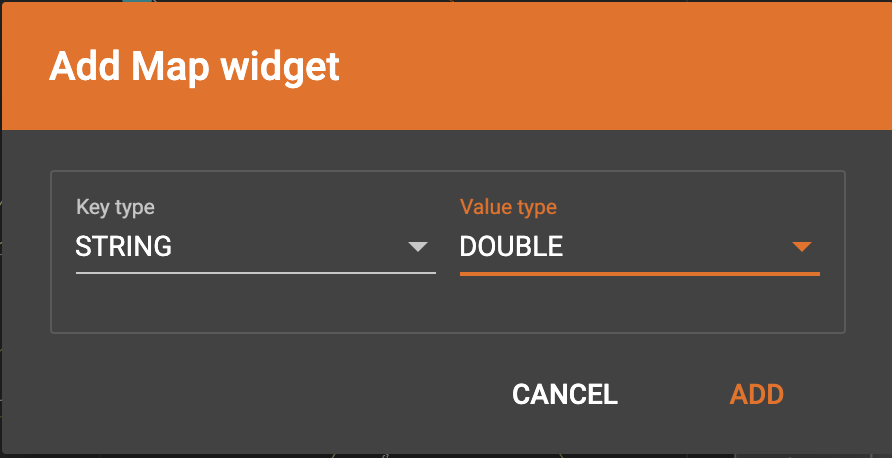
A Map widget will be added to the attribute mapping panel.
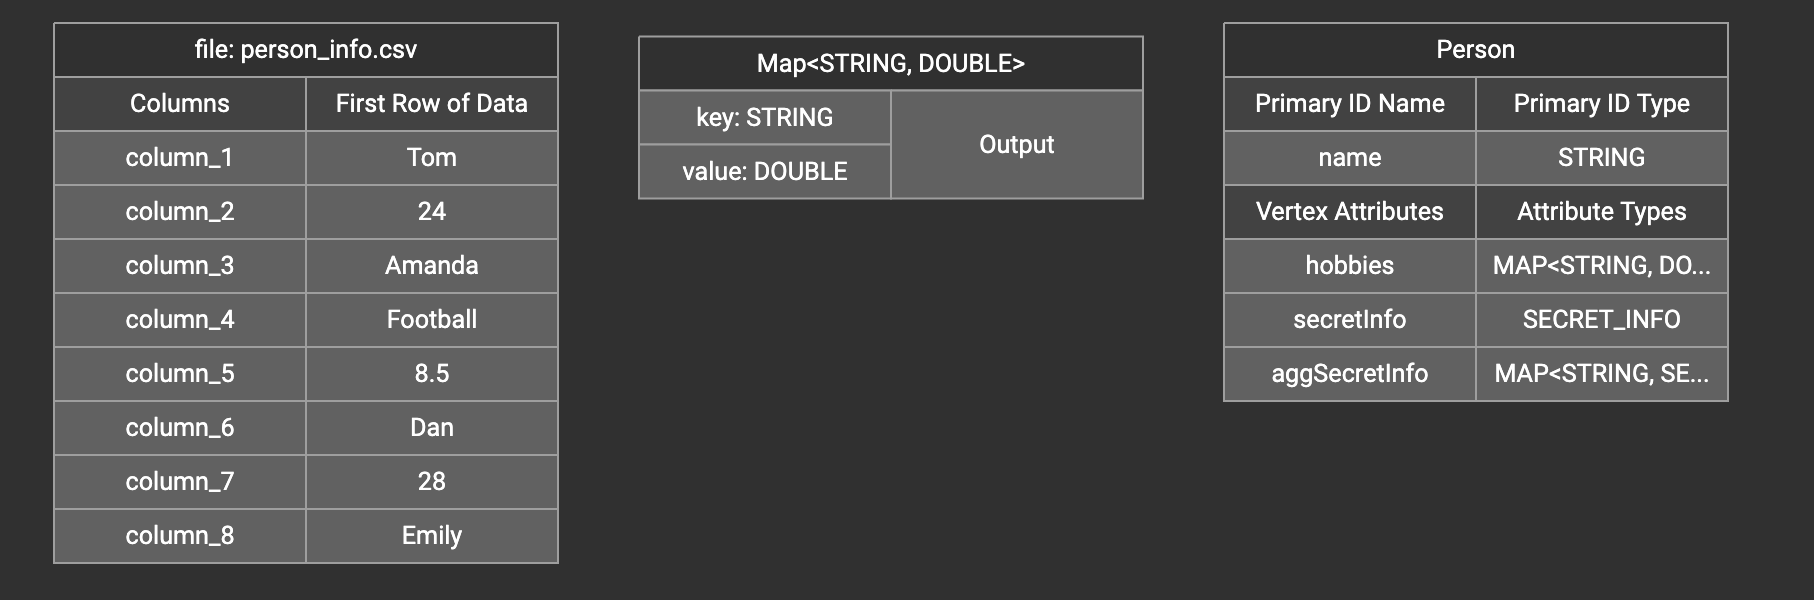
Create the mapping from the data columns to the Map widget, and from the Map widget to the attribute.
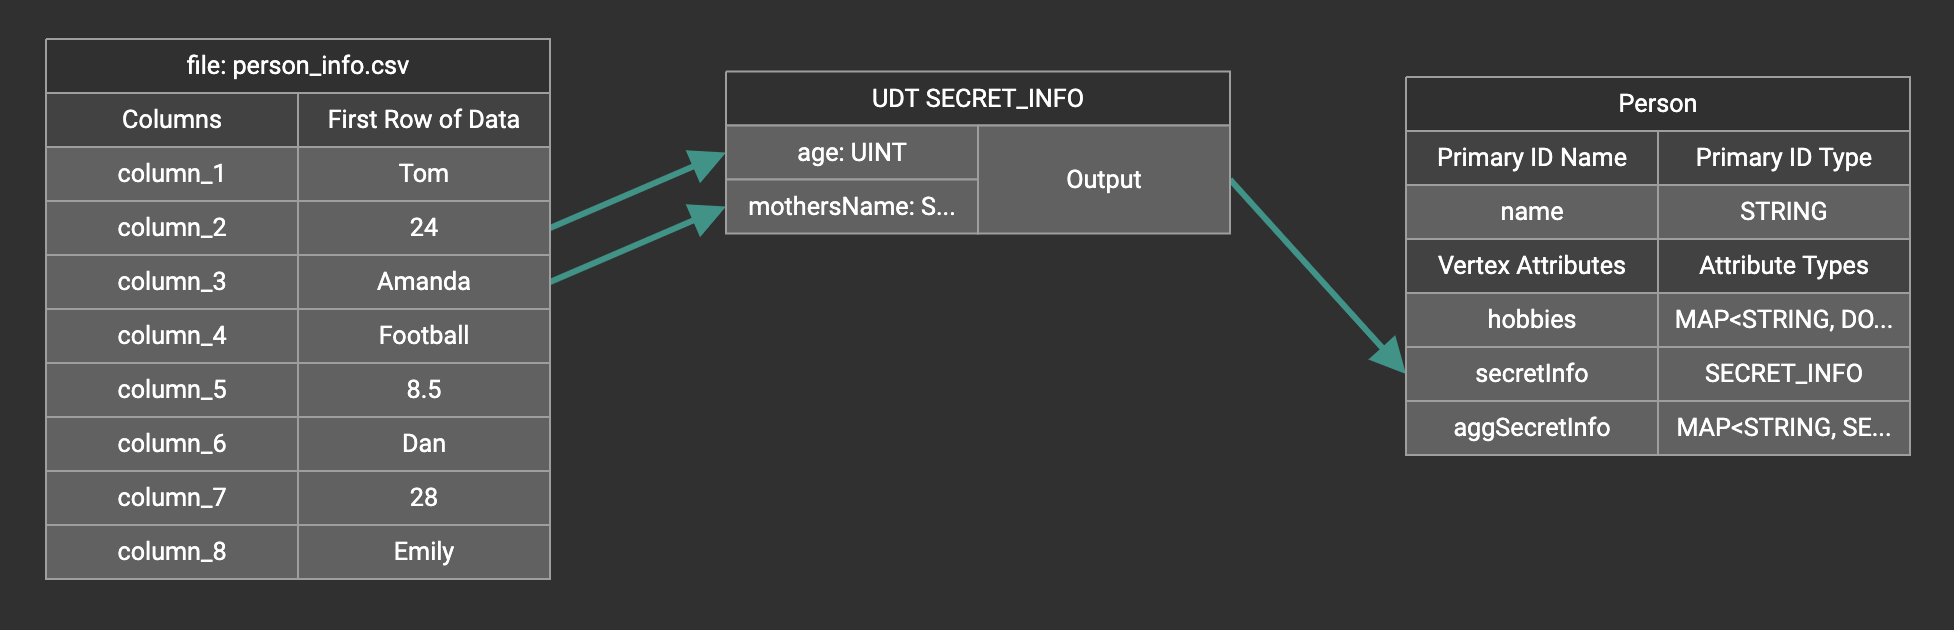
Map data to a UDT type attribute
Choose a UDT name from the dropdown list. The name must match the UDT type of the attribute you are mapping towards.
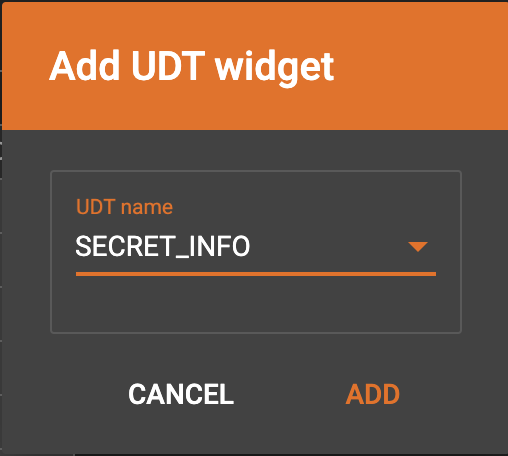
A UDT widget will be added to the attribute mapping panel.
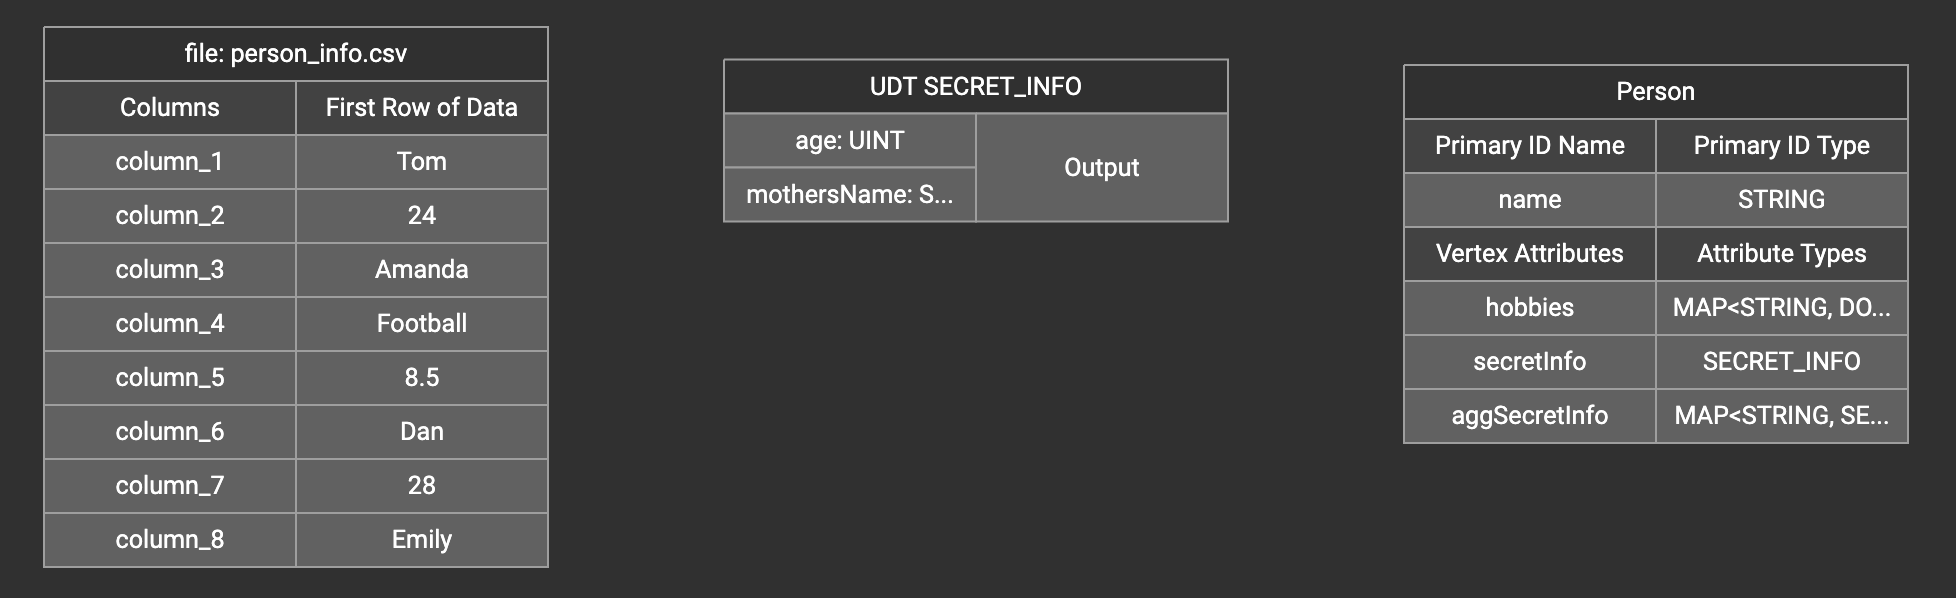
Create the mapping from the data columns to the UDT widget, and from the UDT widget to the attribute.
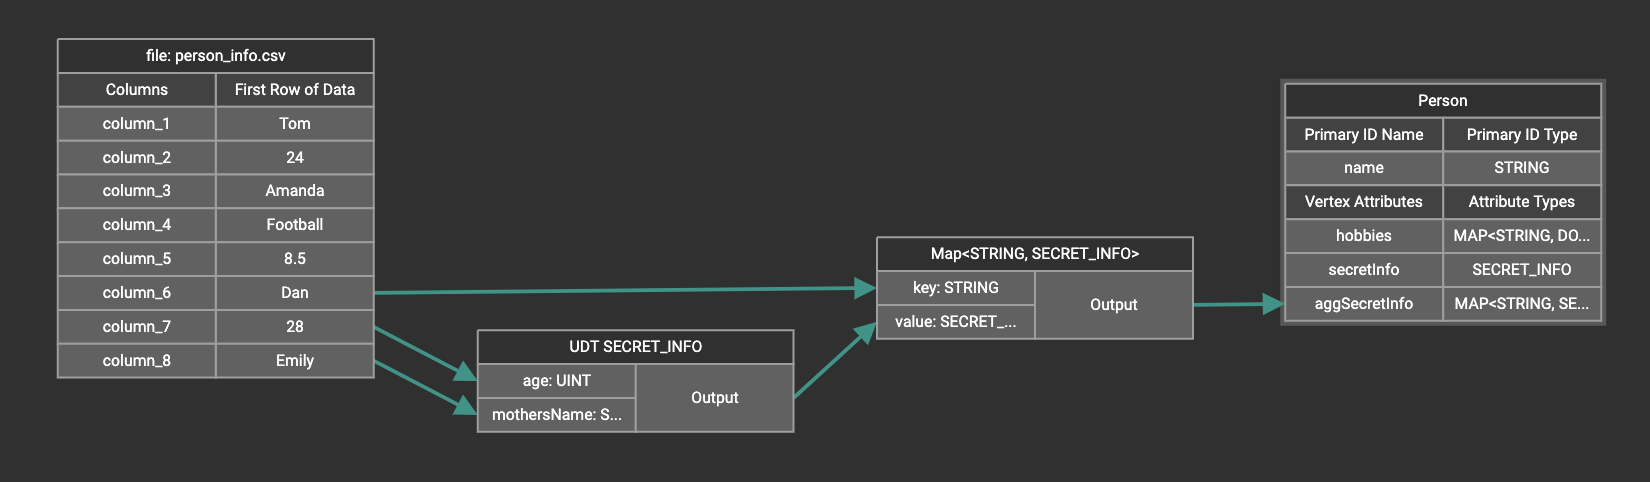
Map data to a map type attribute with UDT value type
If you want to map data to an attribute of map type with UDT value type, you have to combine a Map widget with a UDT widget.
Choose UDT as the value type and then choose the UDT name when adding the Map widget.
Create data mapping between data columns, the UDT widget, the Map widget, and the attribute.
Delete options
In the Map Data To Graph page, you can delete anything that you added.
Choose what you want to delete, then click the delete
button  . Press the
"Shift" key to select multiple icons you want to delete. Note that you
cannot delete vertex or edge types in this page.
. Press the
"Shift" key to select multiple icons you want to delete. Note that you
cannot delete vertex or edge types in this page.
Delete data file to vertex or edge mapping
Select the dashed green link(s) between data file and mapped vertex/edge type, then click the delete button.
Delete data column to vertex or edge attribute mapping
Select the green arrow(s) between data file table and vertex/edge attributes table, then click the delete button.
.png)
Undo and redo
You can undo or redo changes by clicking the Back or Forward buttons,
respectively:  . The
whole history since the time you entered the Map Data To Graph page is
recorded.
. The
whole history since the time you entered the Map Data To Graph page is
recorded.

