Overview
The TigerGraph Admin Portal is a browser-based DevOps tool that provides users an overview of a running TigerGraph system from an application and infrastructure point of view. It also allows users to configure the TigerGraph system through a user-friendly interface. This guide serves as an introduction and quick-start manual for Admin Portal.
Admin Portal is certified on the following browsers:
| Browser | Chrome | Safari | Firefox | Opera | Edge | Internet Explorer |
|---|---|---|---|---|---|---|
Supported version |
54.0+ |
11.1+ |
59.0+ |
52.0+ |
80.0+ |
10+ |
Not all features are guaranteed to work on other browsers.
Please make sure to enable JavaScript and cookies in your browser settings.
Log On
Admin Portal and GraphStudio share the same port (14240). If you are logged in to one of the servers for your TigerGraph system, you can use localhost for your server IP address. The Admin Portal is on the admin page:
http://<tigergraph_server_ip_address>:14240/admin/If user authentication has been enabled, users need to log in to access the Admin Portal.
If you are already at GraphStudio, click the Admin button at the right end of the top menu bar to navigate to Admin Portal.
Page Layout
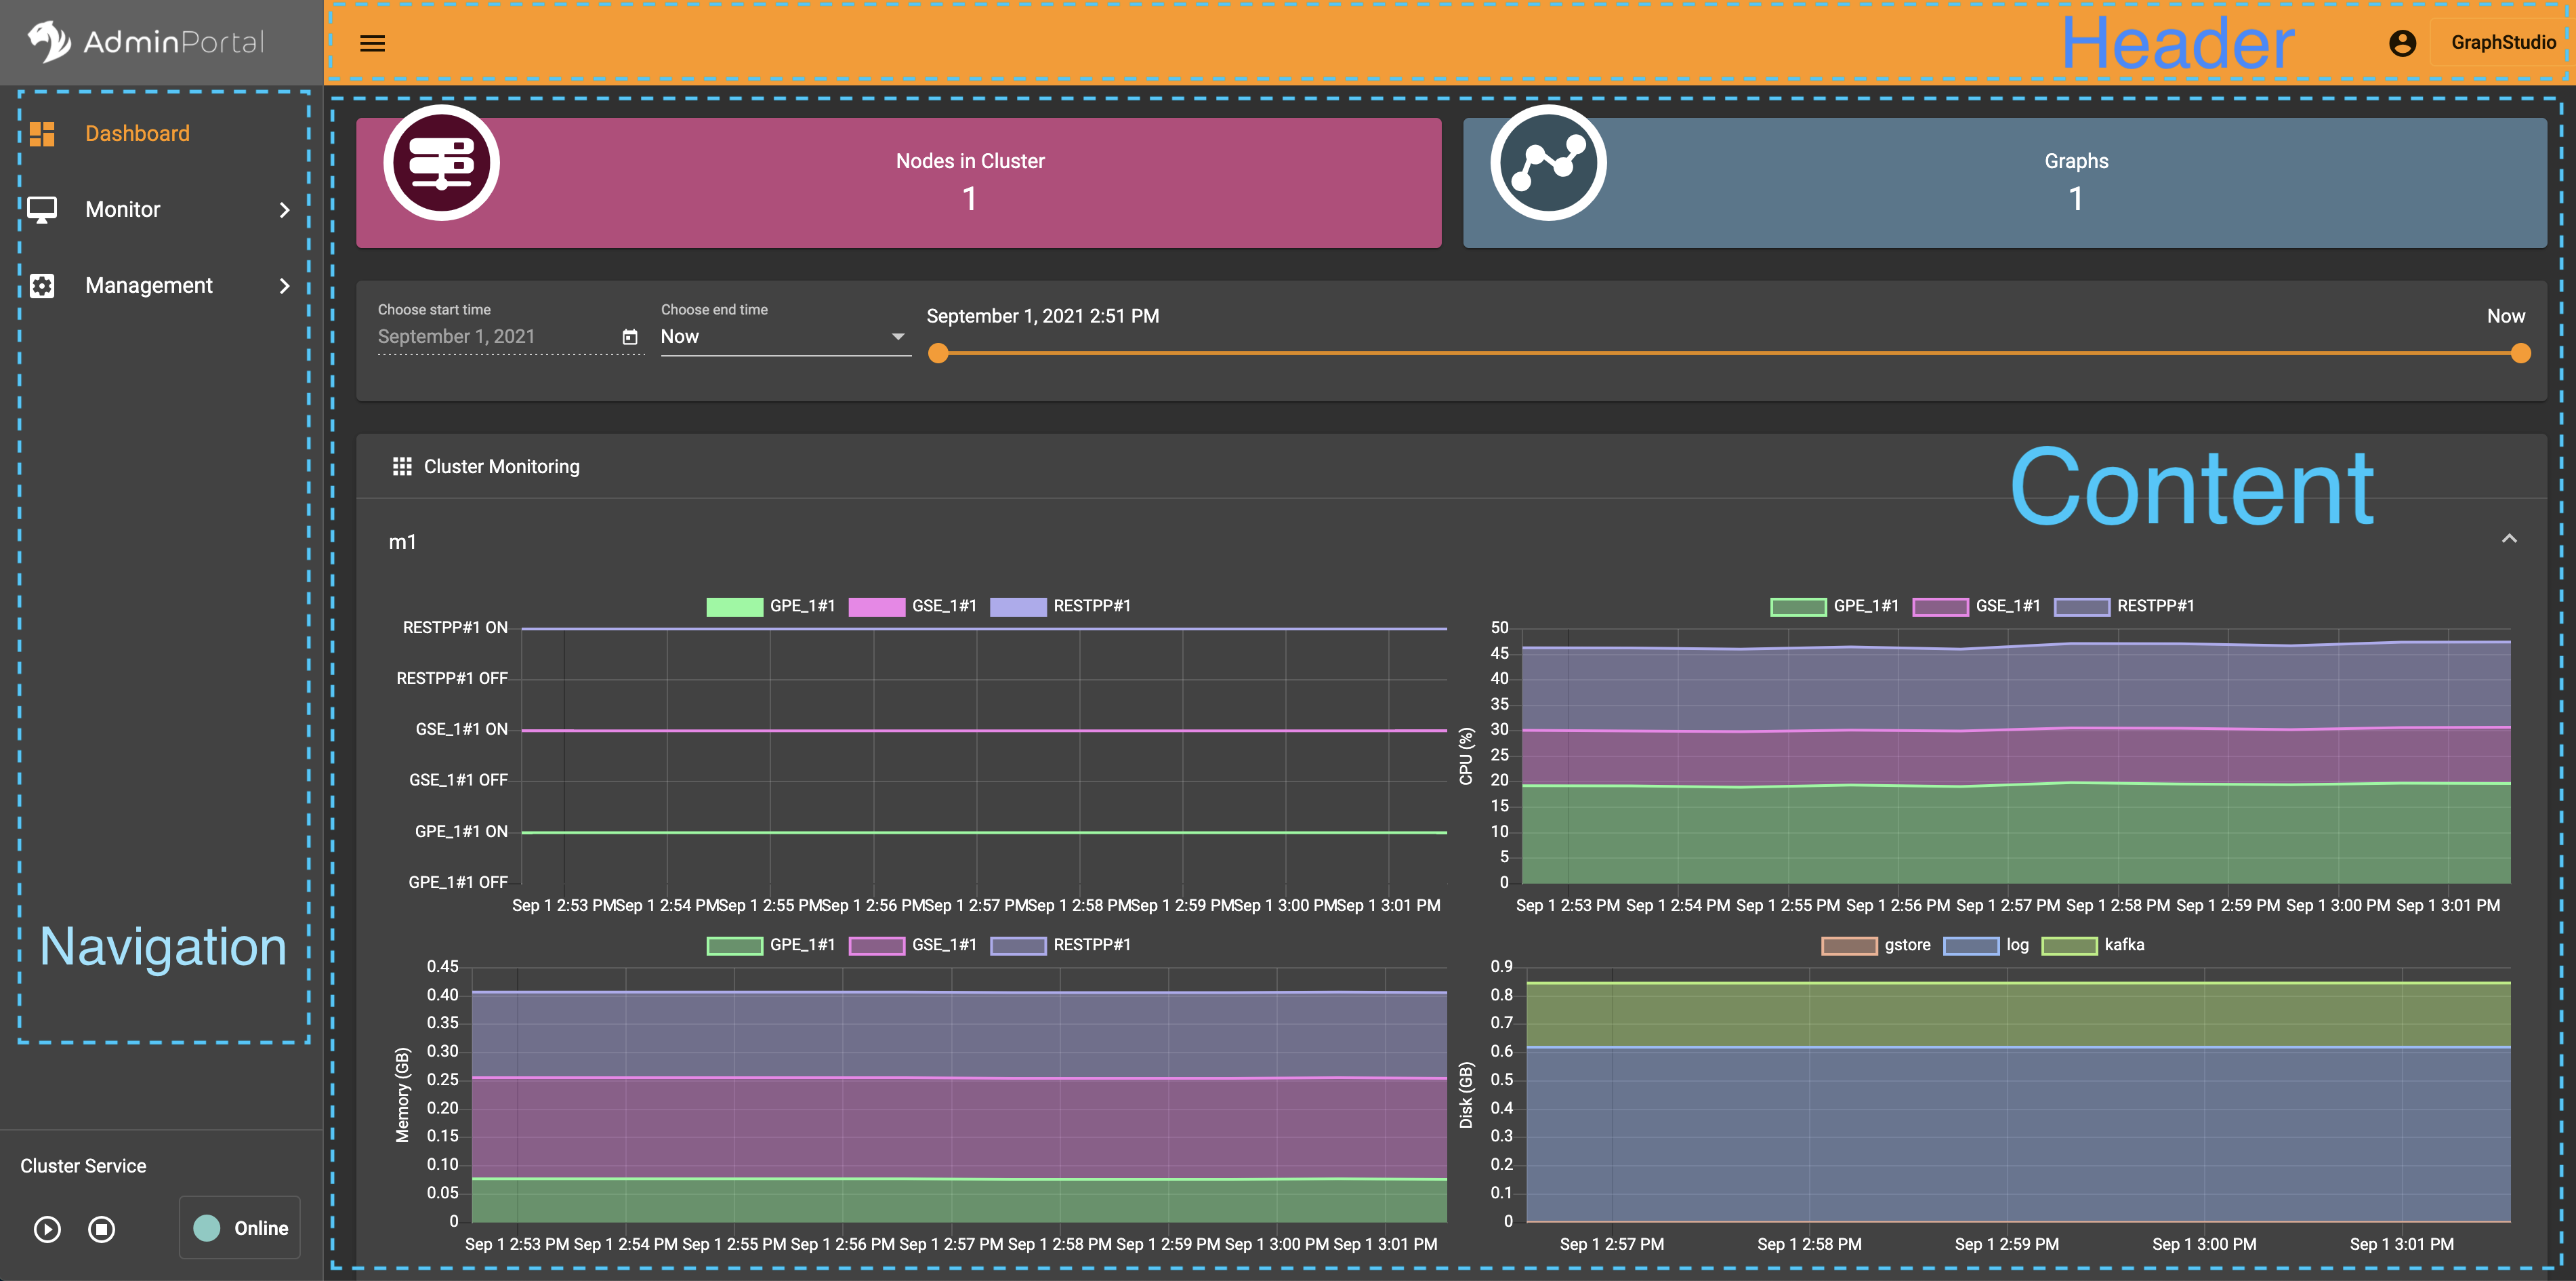
The Admin Portal has three pages: Dashboard, Monitor, and Management. All the pages share the same Header, and Navigation Menu.
|
The layout of the Admin Portal is responsive to screen size. The layout will automatically adjust for devices with small screens like phones and tablets. |
The full-screen version of the Admin Portal is shown below, with the Dashboard page selected.

Page Header
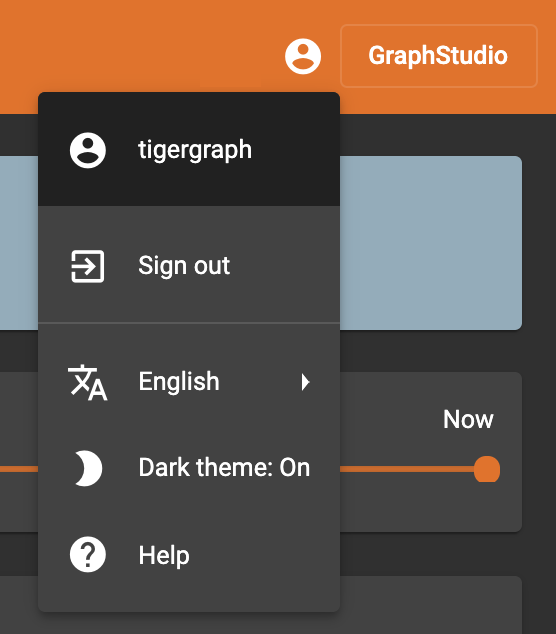
The user menu is accessible from the User icon  in the header.

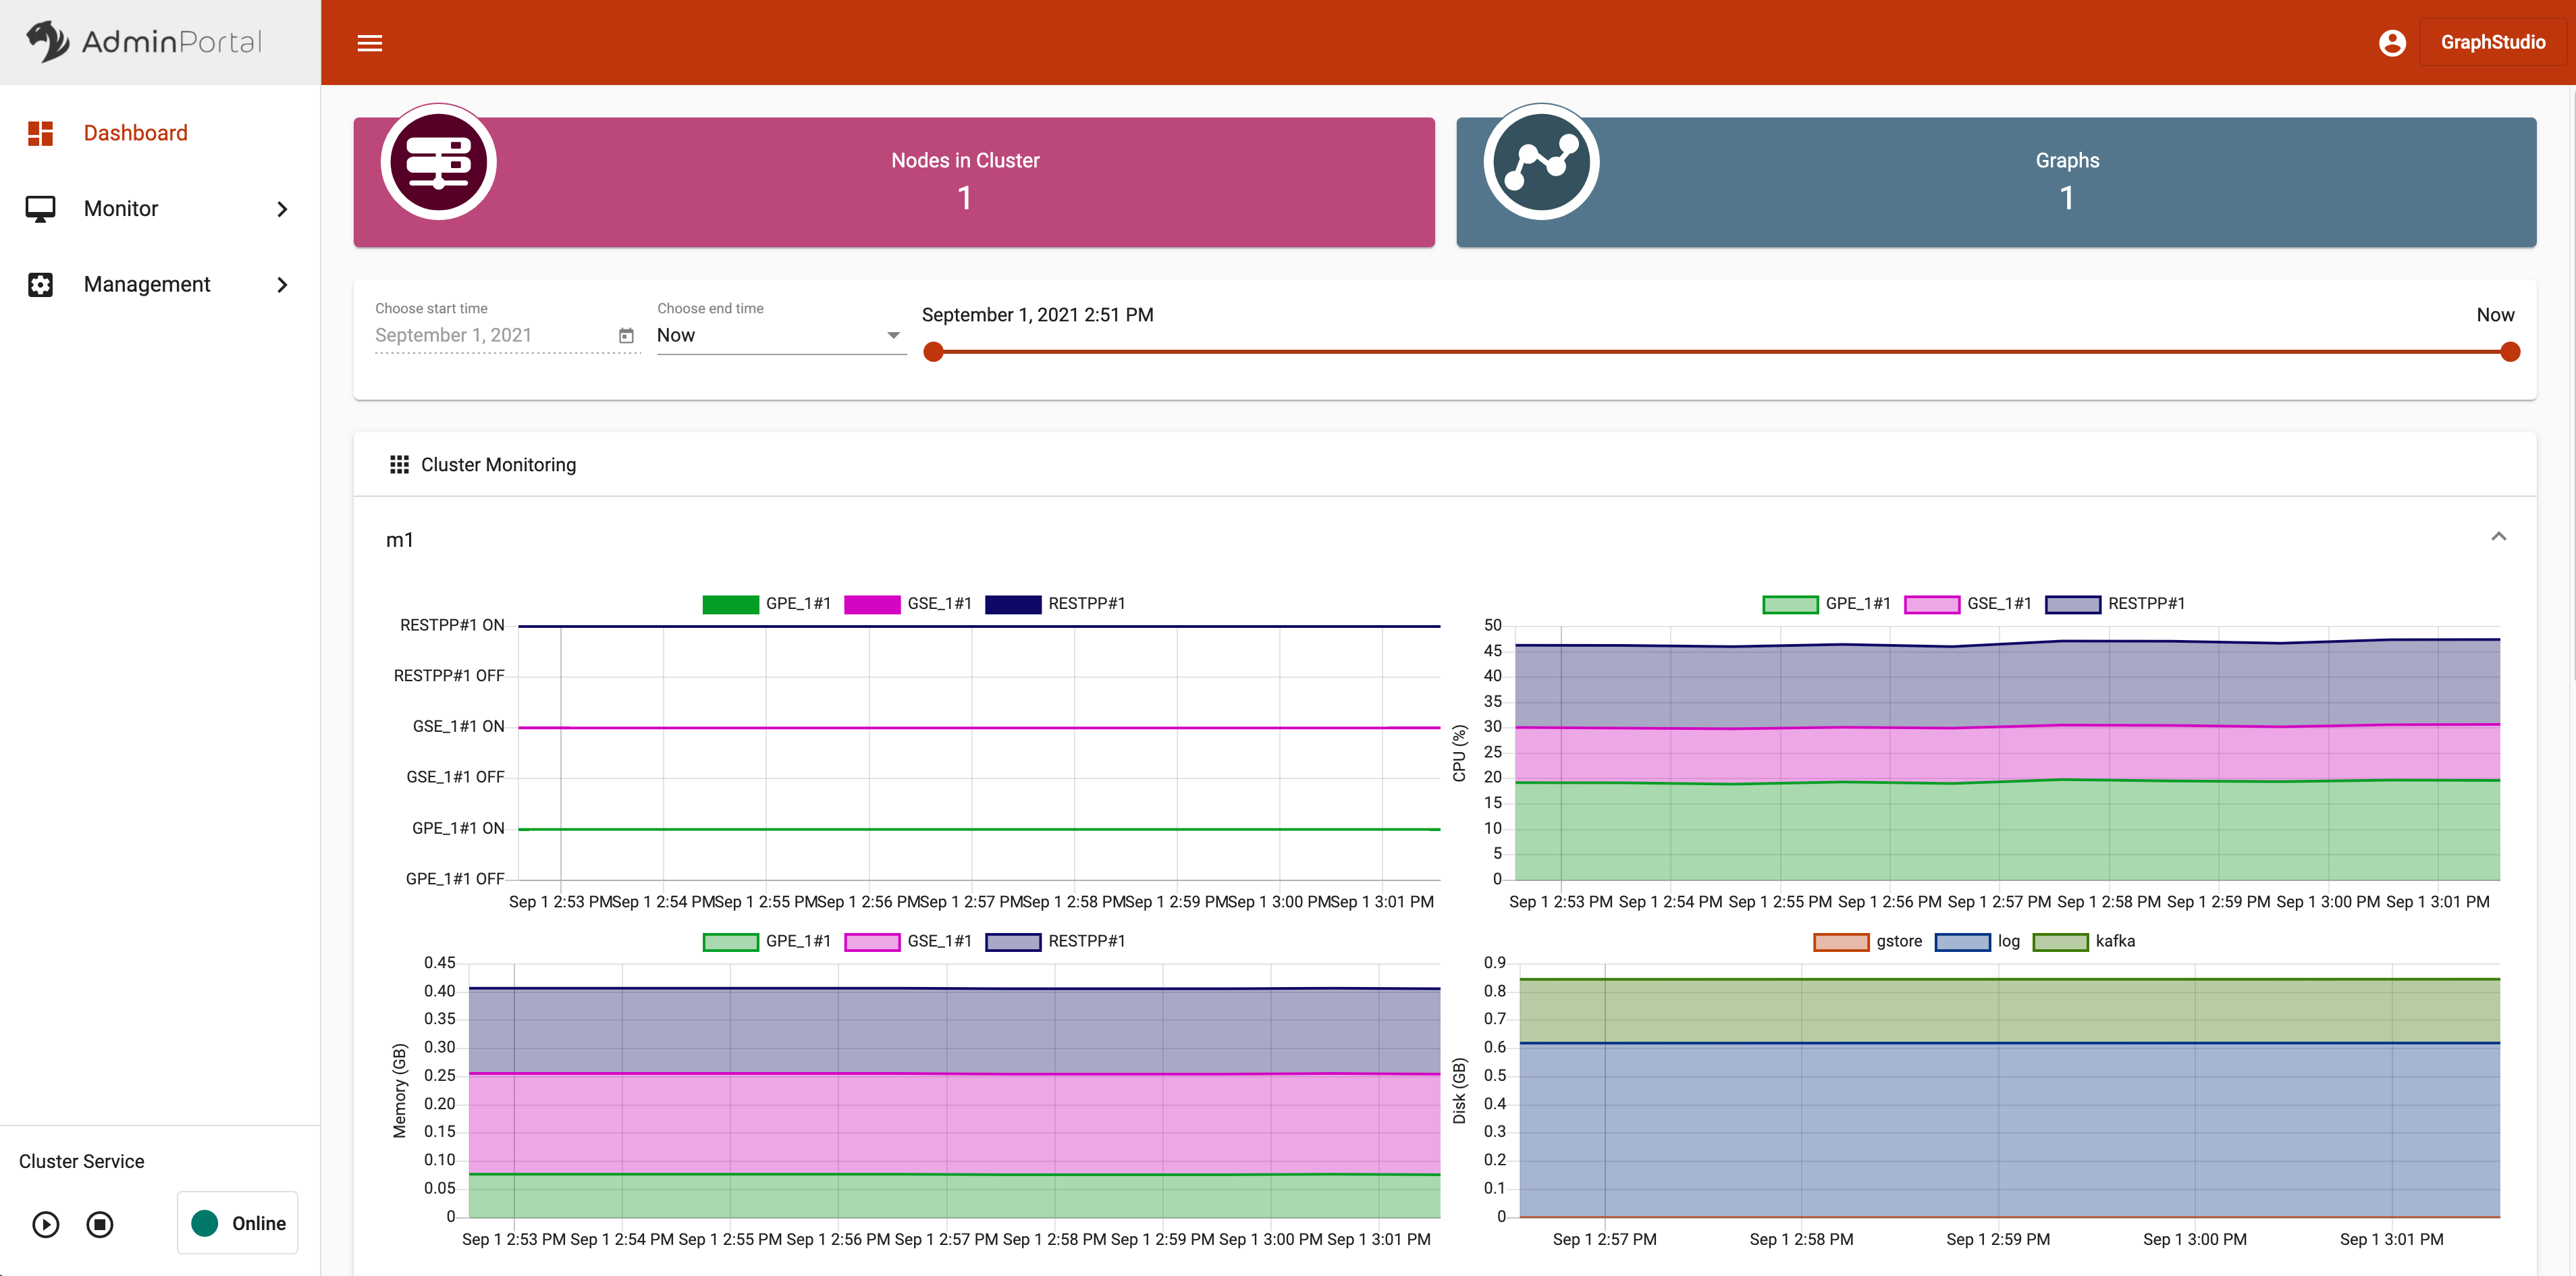
You can switch between a dark theme and a light theme. The light theme is shown below:

To sign out of Admin Portal, click on the Sign out button in the Account menu.
Clicking on the Help button will take you to the documentation page containing this guide.
You can navigate to GraphStudio by clicking on the GraphStudio button in the upper right corner.
Cluster service status
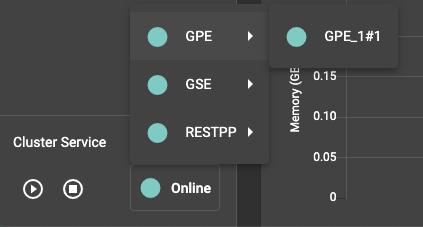
The bottom of the navigation menu shows the cluster service status.

See the Glossary section for information on these services.